
Budgeting is an essential process for any organization, be it a business, government agency, or non-profit. It involves creating a financial plan that outlines expected income and expenses for a specific period. The budgeting process includes various steps, such as forecasting revenue and expenses, setting targets and objectives, and monitoring performance. One of the critical tools used in budgeting is variance analysis, which helps to identify discrepancies between actual and expected results, to identify where the company has fallen short or outperformed expectations.
Budgeting Process
The budgeting process typically starts with developing a strategic plan, which outlines the organization’s goals and objectives for the long-term. This plan sets the tone for the budgeting process and helps to ensure that the financial plan aligns with the organization’s overall strategy. The first step in the budgeting process is forecasting revenue and expenses. This involves gathering data on past performance, market trends, and other factors that may impact the organization’s finances. The forecast should be prepared based on realistic assumptions using appropriate financial modelling methods and techniques. Once the revenue and expense forecasts are complete, the organization can start setting targets and objectives for the budget period. These targets should be specific, measurable, achievable, relevant, and time-bound (SMART), and should also be aligned with the overall goals and objectives.The next step is developing the budget itself. This involves allocating resources to different departments and activities based on the targets set earlier. The budget should be as detailed as possible, covering all aspects of the organization’s operations, including general business expenses. After the budget is developed, it must be approved by the appropriate stakeholders. This may include the board of directors, management team, or other decision-makers within the organization. Once the budget is approved, it becomes the basis for the organization’s financial plan for that period.
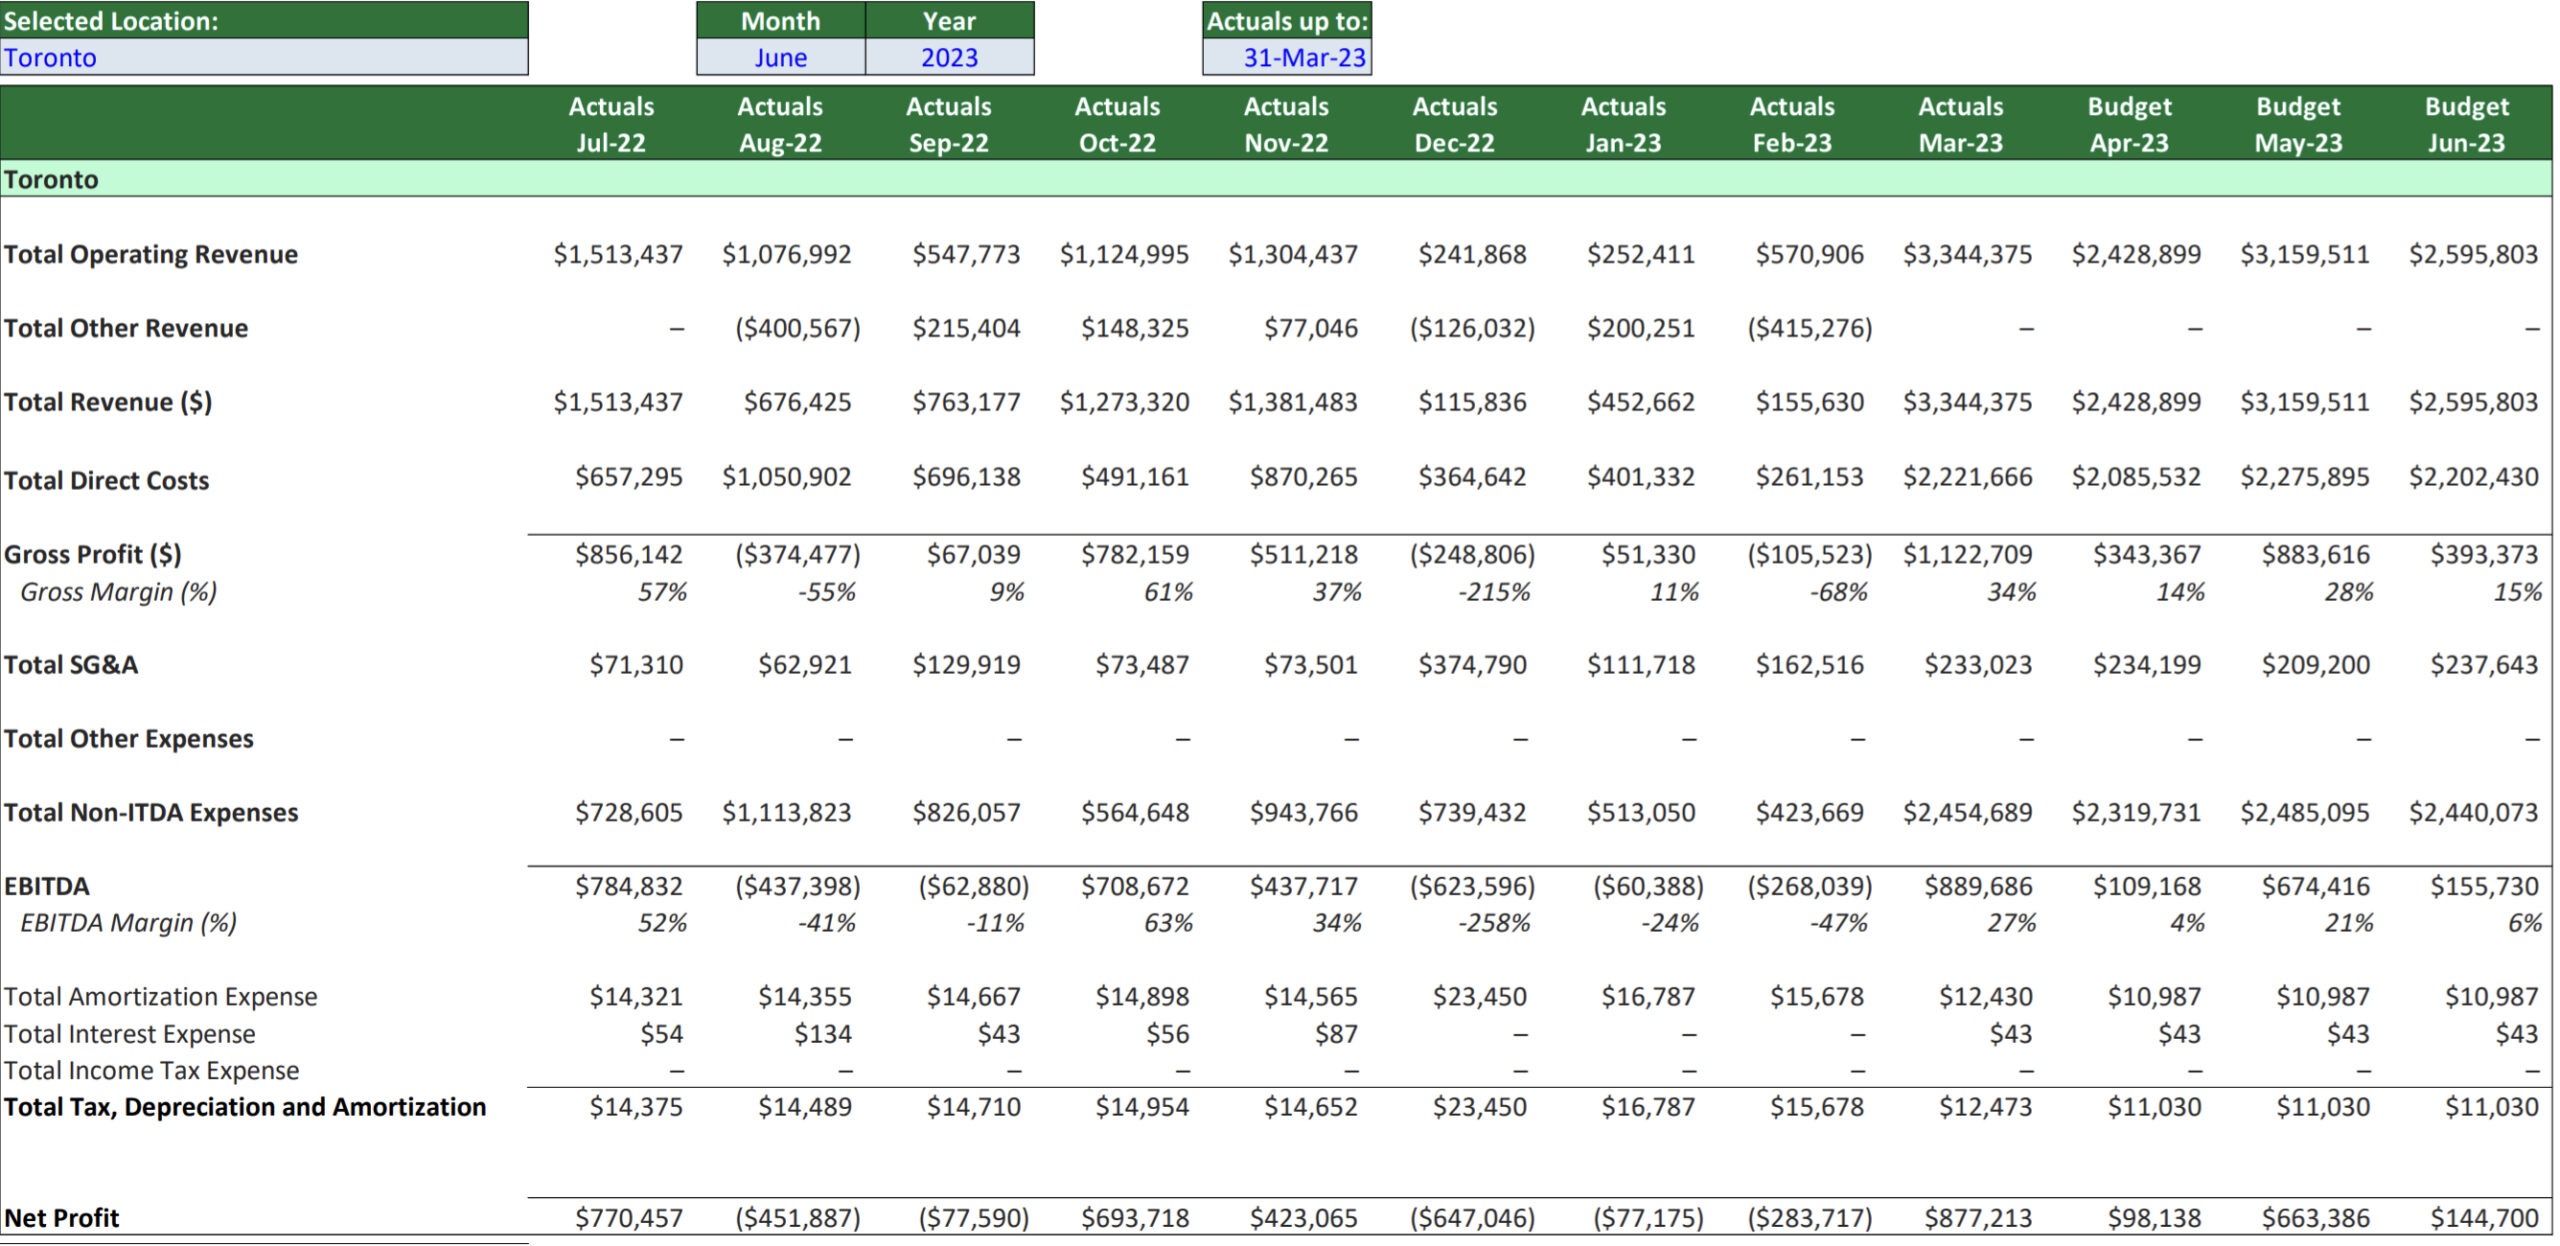
Figure 1) Illustration of actual and budgeted information for trailing twelve-month period
Variance Analysis
Variance analysis is a tool used in budgeting to identify discrepancies between actual and expected results. It involves comparing the actual financial performance with the corresponding budgets and analyzing the differences.
There are two types of variances in such analysis: favorable and unfavorable. A favorable variance occurs when the actual performance exceeds the budgeted amount; while an unfavorable variance occurs when the actual performance falls short of the budgeted amount.
Variance analysis can help organizations to identify areas of their operations that are performing well and areas that need improvement. By analyzing the variances, organizations can identify the root causes of the differences and take corrective action to address them. The management can use this information to determine if it needs to modify its strategies, reduce the budget for the next period, or allocate the excess funds to other areas of the organization.
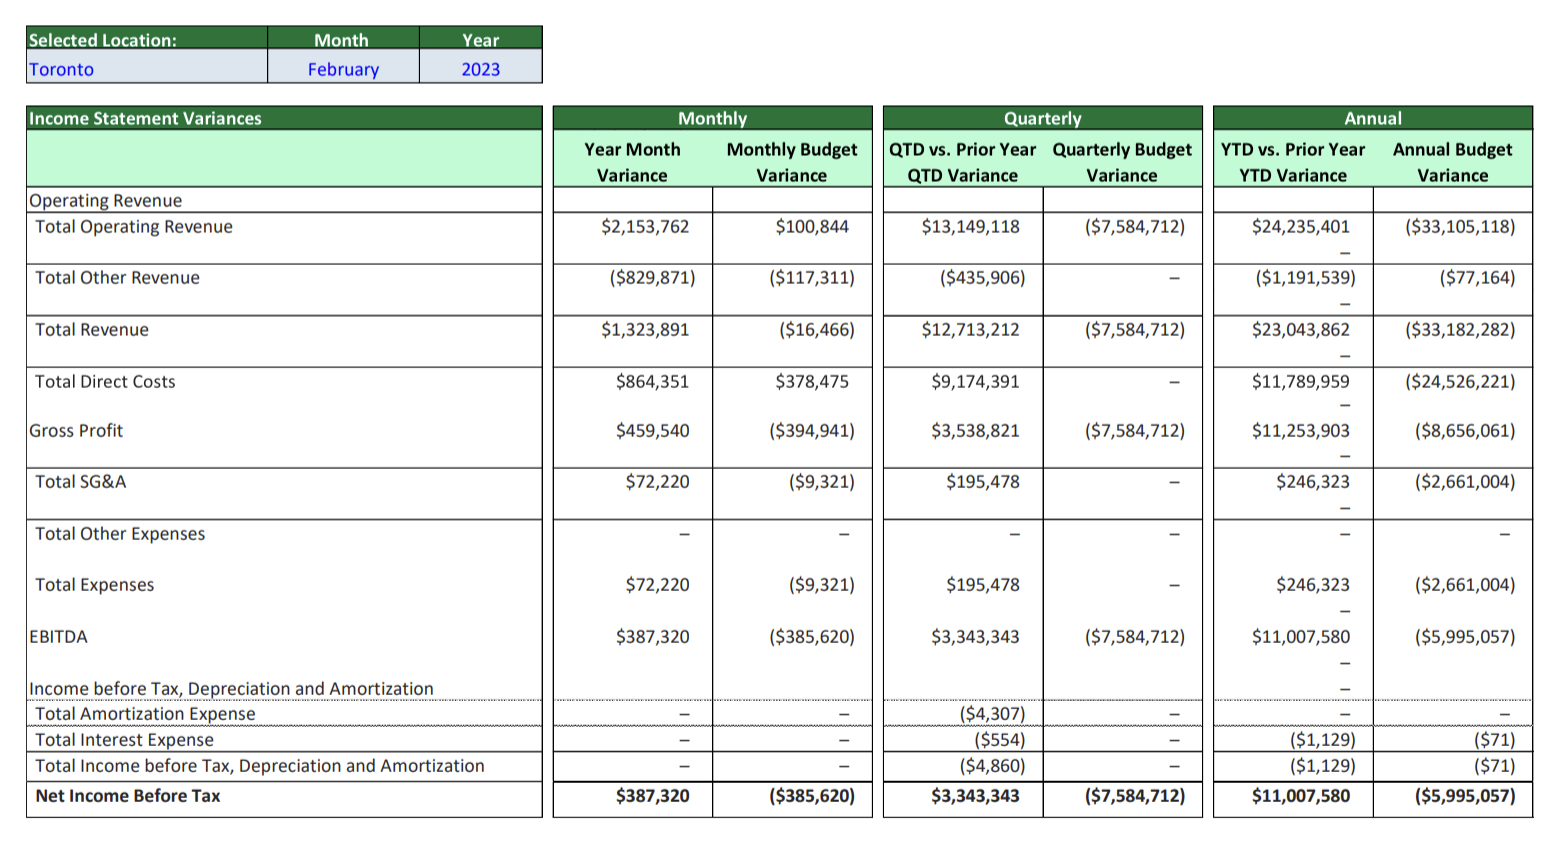
Figure 2) Variance analysis showing monthly, quarterly and annual variances
The budgeting process and variance analysis are essential tools for organizations to manage their finances effectively. By incorporating these tools into their financial management practices, organizations can improve their operations and achieve long-term success.
Sapling assists its clients in creating and/or evaluating their budgeting system and variances, resulting in a well-informed decision-making process for the management. Our organization places a large emphasis on automating as many aspects as possible in the budgeting process and variance analysis, which allows to finance teams to focus their time on analysis and extracting useful insights rather than manually producing reports. To produce a top-notch report for stakeholders, a comprehensive examination of each financial statement item, dynamic review period, visualization of the current state through dashboards, and the presentation of data in various dimensions are crucial.


