
When working with unstructured or structured data alike, choosing the right tool can be a game-changer in terms of time spent on analysis and the value of the insights produced. By far, the most widely used tools for data analysis and visualization are Excel and Power BI, which are both Microsoft products. While each is powerful, they serve distinct purposes and surpass one-another in different situations. Understanding when to leverage one or the other can save time, improve decision-making, and prevent headaches due to each of their own limitations.
Excel has long been a go-to tool for finance professionals looking to complete data analysis, reporting, and build financial models. It offers a straightforward interface, a wide array of formulas available, and powerful features like Power Query, dynamic charts, and VBA based macros to equip users with a degree of automation. Excel is most appropriate for:
- Basic data analysis: Sorting, filtering, and exploring small to medium datasets.
- Financial modeling and budgeting: Excel allows for quickly adjusting key inputs to help assist in making decisions, which Power BI cannot do without significant effort and manual imports.
- Custom calculations: Creating complex formulas tailored to specific needs, where it is easy to experiment with quick, on the fly calculation adjustments.
- Ad hoc reporting: Quickly populate pre-built, templated reports, without setting up complex data connection models.
However, Excel does have rather cumbersome limitations, namely in that it requires manual updates to its data, which can lead to human error in transposing data. Additionally, as data volume grows, performance can slow significantly and even make files unusable; a frustrating and common situation for Excel power users.
When to make the switch to Power BI:
Power BI is a sophisticated data visualization tool designed for handling large-scale data processing and crunching into clean outputs. It can connect directly to nearly any type of data source and allows for automated data collection and the creation of interactive dashboards. Power BI is the obvious choice when:
- Data size exceeds Excel’s capacity: Power BI can handle nearly unlimited amounts of data without performance issues. Data is stored in cloud-based data warehouses, which is accessible anywhere.
- Automated data updates are needed: Power BI can refresh reports automatically directly from data sources, often with zero user interaction required, and as often as needed.
- Interactive and shareable reports are needed: Power BI enables dynamic dashboards that can be shared with multiple stakeholders in real time.
- Data integration from multiple sources: It can seamlessly pull data from databases, cloud services, and APIs. At Sapling, we’re able to pull almost any data source, even going so far as to set up automated daily emails with data when APIs aren’t readily available in the market.
Choosing the Right Tool: A Quick Comparison
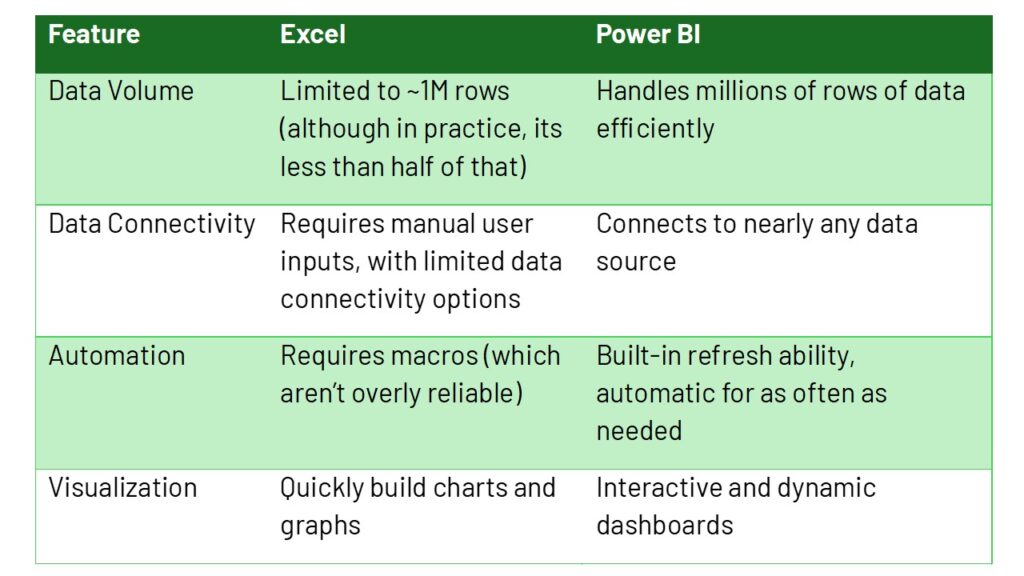
Exhibit 1: Comparison of Excel and Power BI
For users who work primarily with small to medium datasets and need flexibility in quickly adjusting calculations, Excel remains the most reliable choice. However, when dealing with larger datasets, automation, and advanced visualizations, Power BI is the clear winner. At Sapling, we’ve found a winning combination is to first build the visualizations and analysis in Excel, in order to get organizational buy-in, and then later make the investment to transfer those same calculations into Power BI. Ultimately, choosing the right tool depends on your needs, but understanding the strengths of each ensures that your data works for you—not the other way around.


