
Interest rates, inflation, stock prices, bond yields – you’ve probably heard many of these mentioned in the news over the past year. Consumers and businesses alike track these signals to gain a picture of the current health of the economy. Economic indicators are not only constrained in “fiscal” roots such as those mentioned above – other examples include housing starts, labour force rates, and electricity consumption per capita.
A few key common indicators include:
- GDP
- Gross Domestic Product is a measure of the market value of all final goods and services produced within a certain period in a particular jurisdiction. This indicator is useful in tracking macro-level changes and can be measured with inflation (“Real GDP”), or without inflation (“Nominal GDP”)
- CPI
- The Consumer Price Index measures the changes in prices of baskets of goods and services over specified time periods and is often used as a proxy to measure inflation. CPI can be used as an aggregate tool to track consumer spending patterns, and includes goods such as food, transportation, and shelter. These items are weighed differently on the proportional spending by consumers (e.g., consumers will typically spend more on shelter (rent or mortgage) than they would on transportation)
- Yield Curves
- Yield curves are graphical representations of a bond’s interest rates with different maturity dates (such as 10-, 20- and 30-year Treasury bonds) which can be used to forecast economic growth and interest rates. The shape of the curve provides insights into how investors view the future:
The normal curve has an upward slope, where bonds with shorter timespans/maturities offer lower returns/yields, whilst bonds with greater maturity dates offer higher yields. This curve is common in situations of economic growth
The inverted curve has a downward slope, where the short-term yields are higher than the long-term yields. Recessions will often feature inverted yield curves
The flat curve, in which returns are consistent across maturities. These curves correspond to situations of uncertainty, where investors may anticipate a recession in the future
- Yield curves are graphical representations of a bond’s interest rates with different maturity dates (such as 10-, 20- and 30-year Treasury bonds) which can be used to forecast economic growth and interest rates. The shape of the curve provides insights into how investors view the future:
- Overnight Rate
- The overnight rate is the interest rate set by a country’s Central Bank and is used as a tool to control inflation. Banks will use the overnight rate to borrow or lend funds between each other, and it is often the lowest interest rate available
- Unemployment Rate/Labour Force Participation Rate
- The labour force consists of all individuals who have a job or are actively seeking employment. The participation rate measures the percentage of individuals who are in the labour force against the total eligible working population
- The unemployment rate represents the percentage of individuals within the labour force who are unemployed
- These statistics (amongst others) can be used to interpret the quality of the job market, which plays a role in measuring overall economic health
- Housing Starts
- Housing starts represent the construction of new residential housing builds, and cover both detached homes and multifamily homes (where each family’s home is considered one start)
- These starts are affected by seasonality (i.e., less builds in the winter for harsher climates), and data is often adjusted to account for this effect. Housing starts can reflect demand and trends for housing in particular geographies, which can be used by developers, investors, and policymakers for analysis
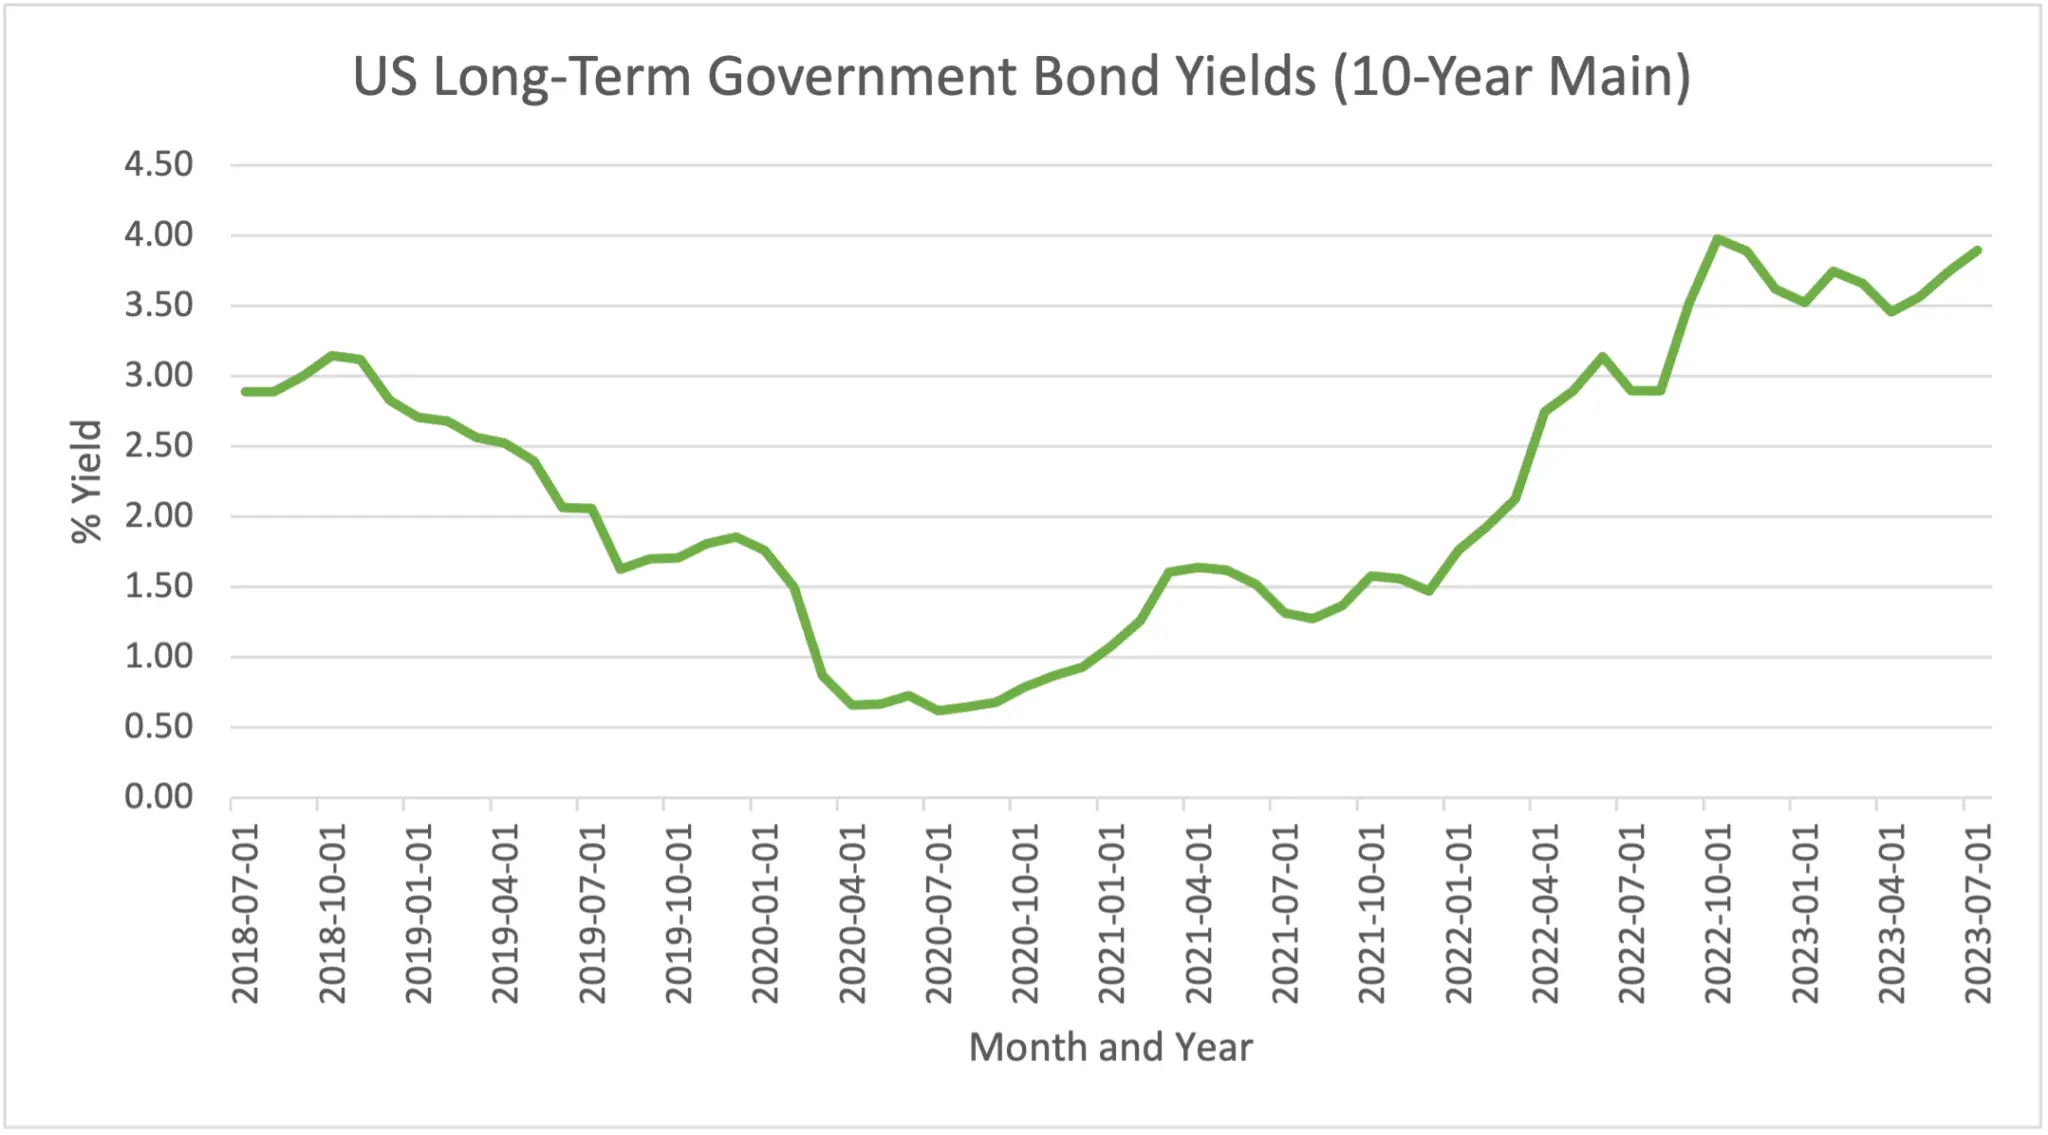
Exhibit A: US Government 10 Year Bond Yields (1)
Data for these indicators (and many others) remains readily available to the public – , and the in the USA all have datasets regarding key economic indicators such as GDP, CPI, population growth and the labour force.
Yield curves and interest rates are available from the Bank of Canada and the US Federal Reserve Economic Database (FRED). Exhibit A depicts the historical 5-year performance of US Government 10 Year bonds. Housing starts are available from the Canadian Mortgage and Housing Corporation (CMHC) and FRED, whilst Teranet and produce reports on Canadian house prices monthly.
For more granular data, some organizations provide Application Programming Interfaces (APIs) to allow you to download large datasets, for example:
Sapling makes use of the data underlying these indicators to provide in-depth analyses for clients. Inflation rates are often included in our financial models and may be changed by the end-user for forecasting purposes. Sapling has also used data from Teranet and the CMHC for housing prices and starts, which was used to measure aggregate risk levels that homebuilders may face when entering new markets.


