
Revenue projections can make or break business decisions, yet many companies still rely on static models that struggle to keep up with shifting market conditions. Businesses need accurate and adaptable tools to predict their revenue and manage costs effectively. A dynamic revenue forecasting model allows financial professionals to project future financial performance under different market conditions. Unlike static models, which require extensive manual adjustments, Sapling’s dynamic revenue forecasting models automatically adjust outputs based on changing inputs, giving financial professionals real-time insights, and thus making them invaluable for strategic decision-making.
What Does a Dynamic Revenue Forecasting Model Contain?
A dynamic revenue forecasting model is a comprehensive tool designed to provide real-time financial projections, demonstrating detailed and comprehensive impact of decisions over the course of several years. It typically includes:
- Sales and Cost Inputs: These include expected driver-based sales revenue and anticipated expenses such as wages, rent, raw materials, and other operating costs. Sales revenues can be segmented by product lines, such as geographic regions, projects, sales by manager, or a variety of other categories. Adjustments can be made accordingly either through inputs, seasonality, as a percentage of total sales, or predefined growth rates.
- Financial Statement Generation: Sapling’s models automatically generate comprehensive financial statements including annual profit and loss statements, balance sheets, and cash flow statements based on input data, as well as in-depth monthly breakdowns of each. Sapling models also have summary tables with key performance indicators tailored to the clients’ needs and industry, as well as financial analysis through key ratios and return statistics by stakeholder.
- Set Terms and Rates: A dynamic model accounts for asset depreciation schedules, loan terms, tax rates, and other set financial terms, ensuring an accurate representation of the environment in which the inputs take place.
Scenario Analysis: A dynamic revenue forecasting model should include various market condition scenarios to help businesses assess potential financial outcomes. These may include:
- Base Case: A standard forecast based on expected conditions.
- Best Case: An optimistic scenario that assumes higher-than-expected revenue or lower costs.
- Worst Case: A conservative approach considering potential downturns or unexpected costs.
The below example from a Sapling model illustrates a toggle for scenarios, with the best-case scenario for the hypothetical company selected. By simply switching the selected scenario to 2 or 3, the model will automatically adjust the inputs to the base-case or worst-case.
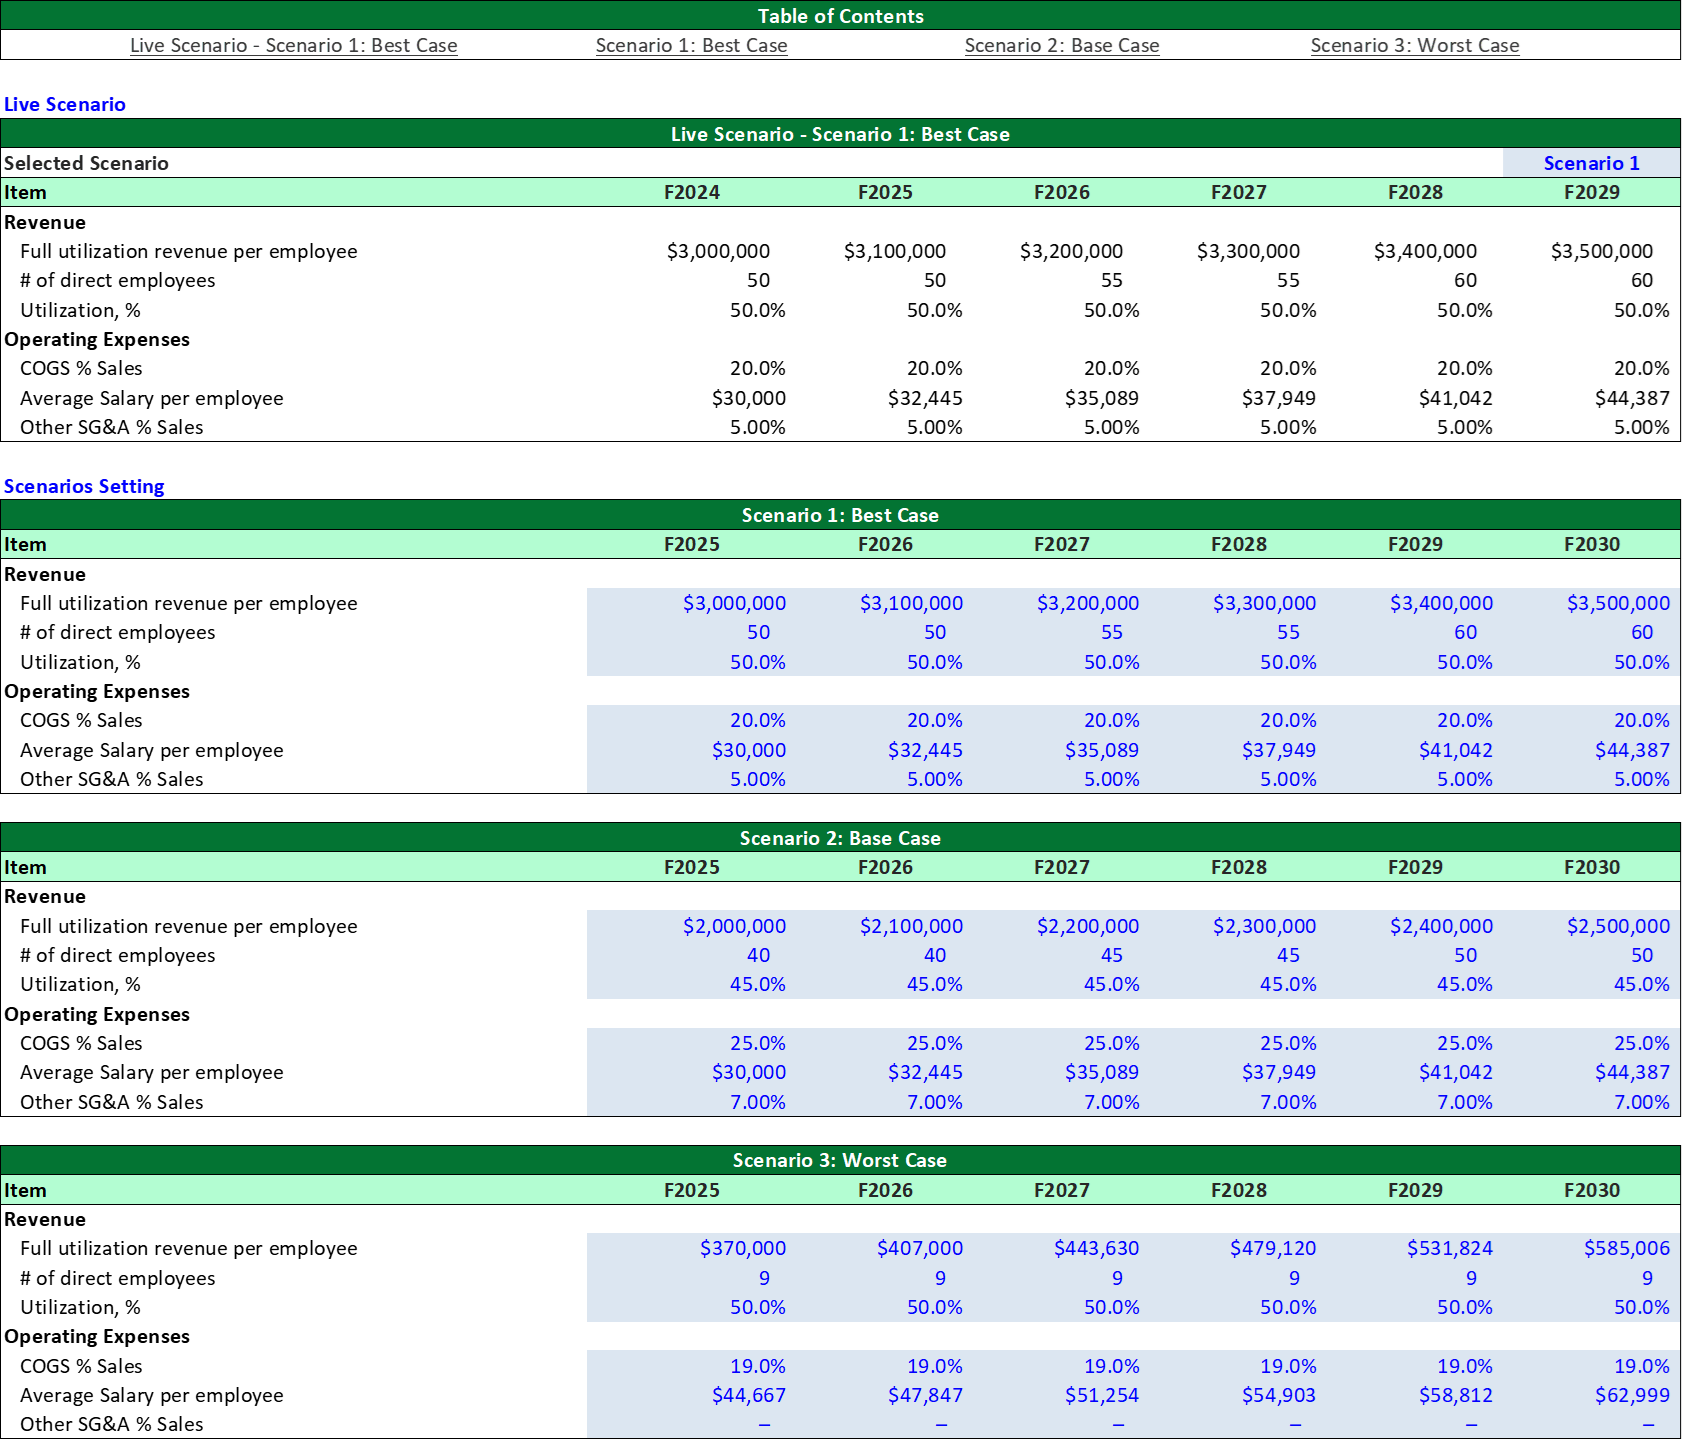
Exhibit A: An Example of Scenario Dash Build by Sapling. The user can input three scenarios in the input section. By a flip of a switch, the user can specify which one of the three scenarios are used for model calculations.
Automated Adjustments: Summary statistics, financial statements, tax obligations, and debt covenants are recalculated in real-time as inputs change, providing instant insights for the user based on any change in forecasts.
Benefits of a Dynamic Revenue Forecasting Model
Implementing a dynamic revenue forecasting model offers several advantages to executives, acquiring companies, or investors:
- Accessibility: The simplicity of the inputs makes the model accessible to a wide range of stakeholders, allowing them to test their own assumptions and examine their returns from any applicable transaction or investment.
- Time Efficiency: Executives can quickly evaluate different financial scenarios with simple toggles, eliminating the need for time-consuming recalculations and manual adjustments or reliance on analysts. They can also adjust the models instantly based on changing accounting/tax assumptions, such as changing depreciation, goodwill amounts, or tax rates.
- Stress Testing and Scenario Planning: Businesses can model different financial outcomes and assess risk exposure. Moreover, if debt covenants exist, the model can indicate when they may be breached, allowing for proactive financial planning.
- Enhanced Decision-Making: By clearly displaying revenue streams and expense breakdowns, the model helps users identify financial strengths and weaknesses, leading to more informed strategic decisions.
When Does It Make Sense to Build One?
A dynamic revenue forecasting model is particularly useful in several financial planning and analysis (FP&A) situations, including:
- Revenue and Expense Forecasting: When projecting and consolidating revenues and expenses across different business lines and departments, a quality dynamic model ensures a high degree of realism and adaptability across possible situations.
- Mergers and Acquisitions (M&A): The buyer or seller can use revenue forecasting models to assess how historical financials may change under new leadership or structural adjustments. This can help the user quantify the impact of synergies and increased managerial expertise of the combined company. Exhibit B is an example of Sapling’s model, demonstrating a summary of returns table that a dynamic model may have, breaking down key statistics by investor.
- Financial Planning & Analysis (FP&A): The model aids in identifying underperforming revenue lines, disproportionate cost drivers, and other areas for increasing profitability. Additionally, it can highlight faulty assumptions, such as inaccurate depreciation estimates, ensuring financial accuracy.
- Investors: Prospective investors are interested in a company’s financial health, financial future, impact of their investment, and potential returns. The below example from Sapling’s model demonstrates key return statistics by investor, considering the time-value of money, among other metrics determined by the user.
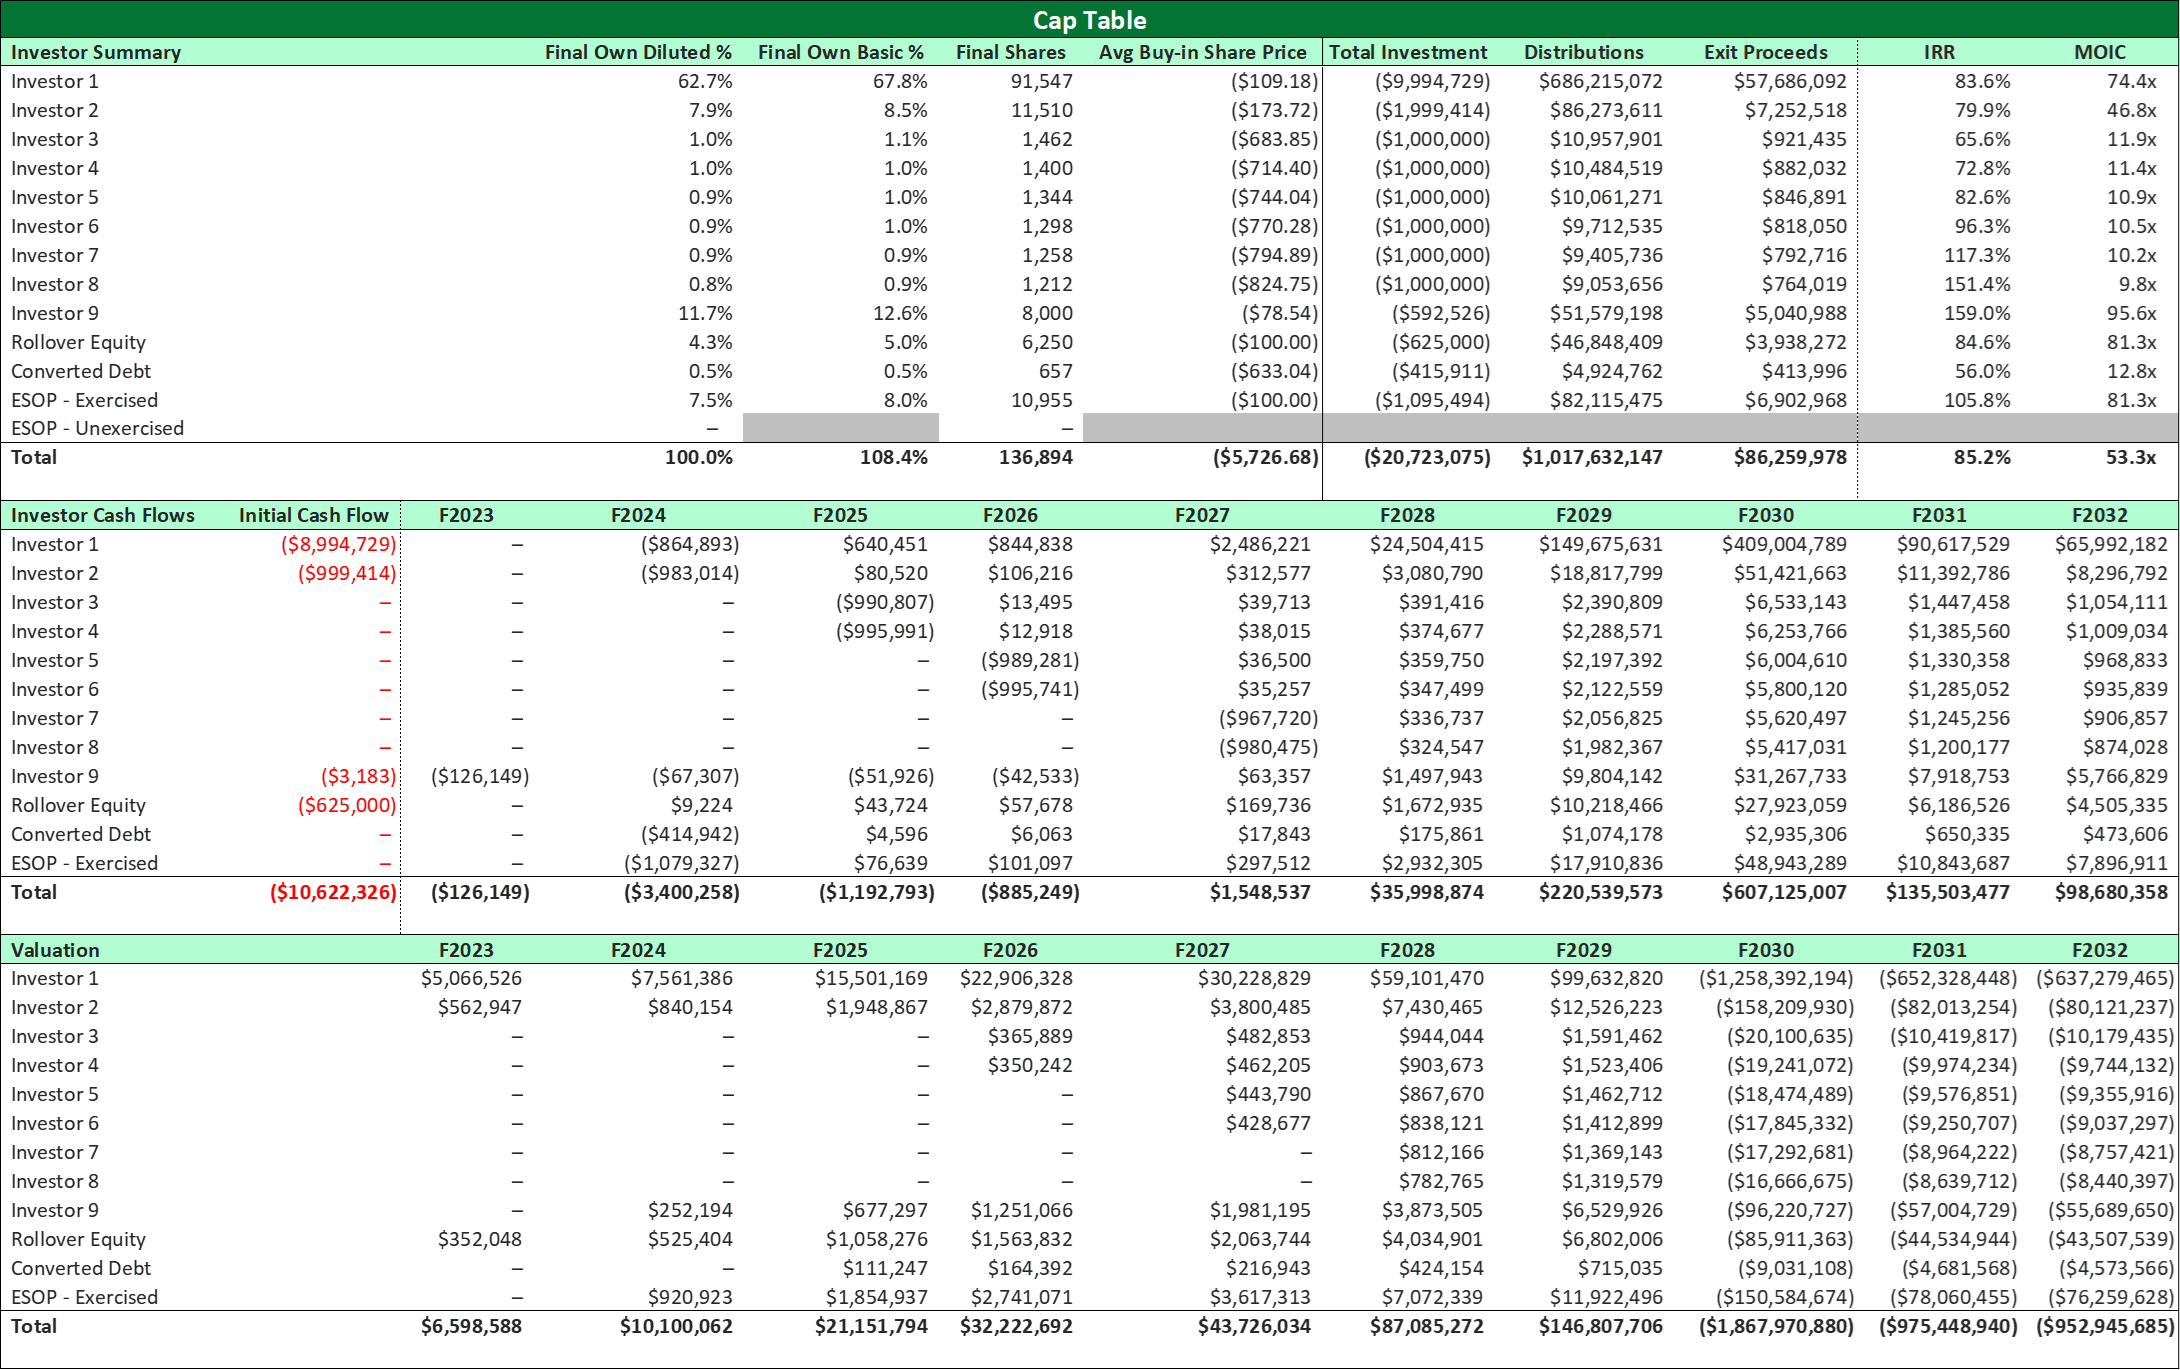
Exhibit B: Sample Return by Investor Calculation. In this example, the model has detailed calculation of cash flow, key return metrics to each investor. This set of output provides additional information on the timing of the cash flows and the value attribute to each investor.
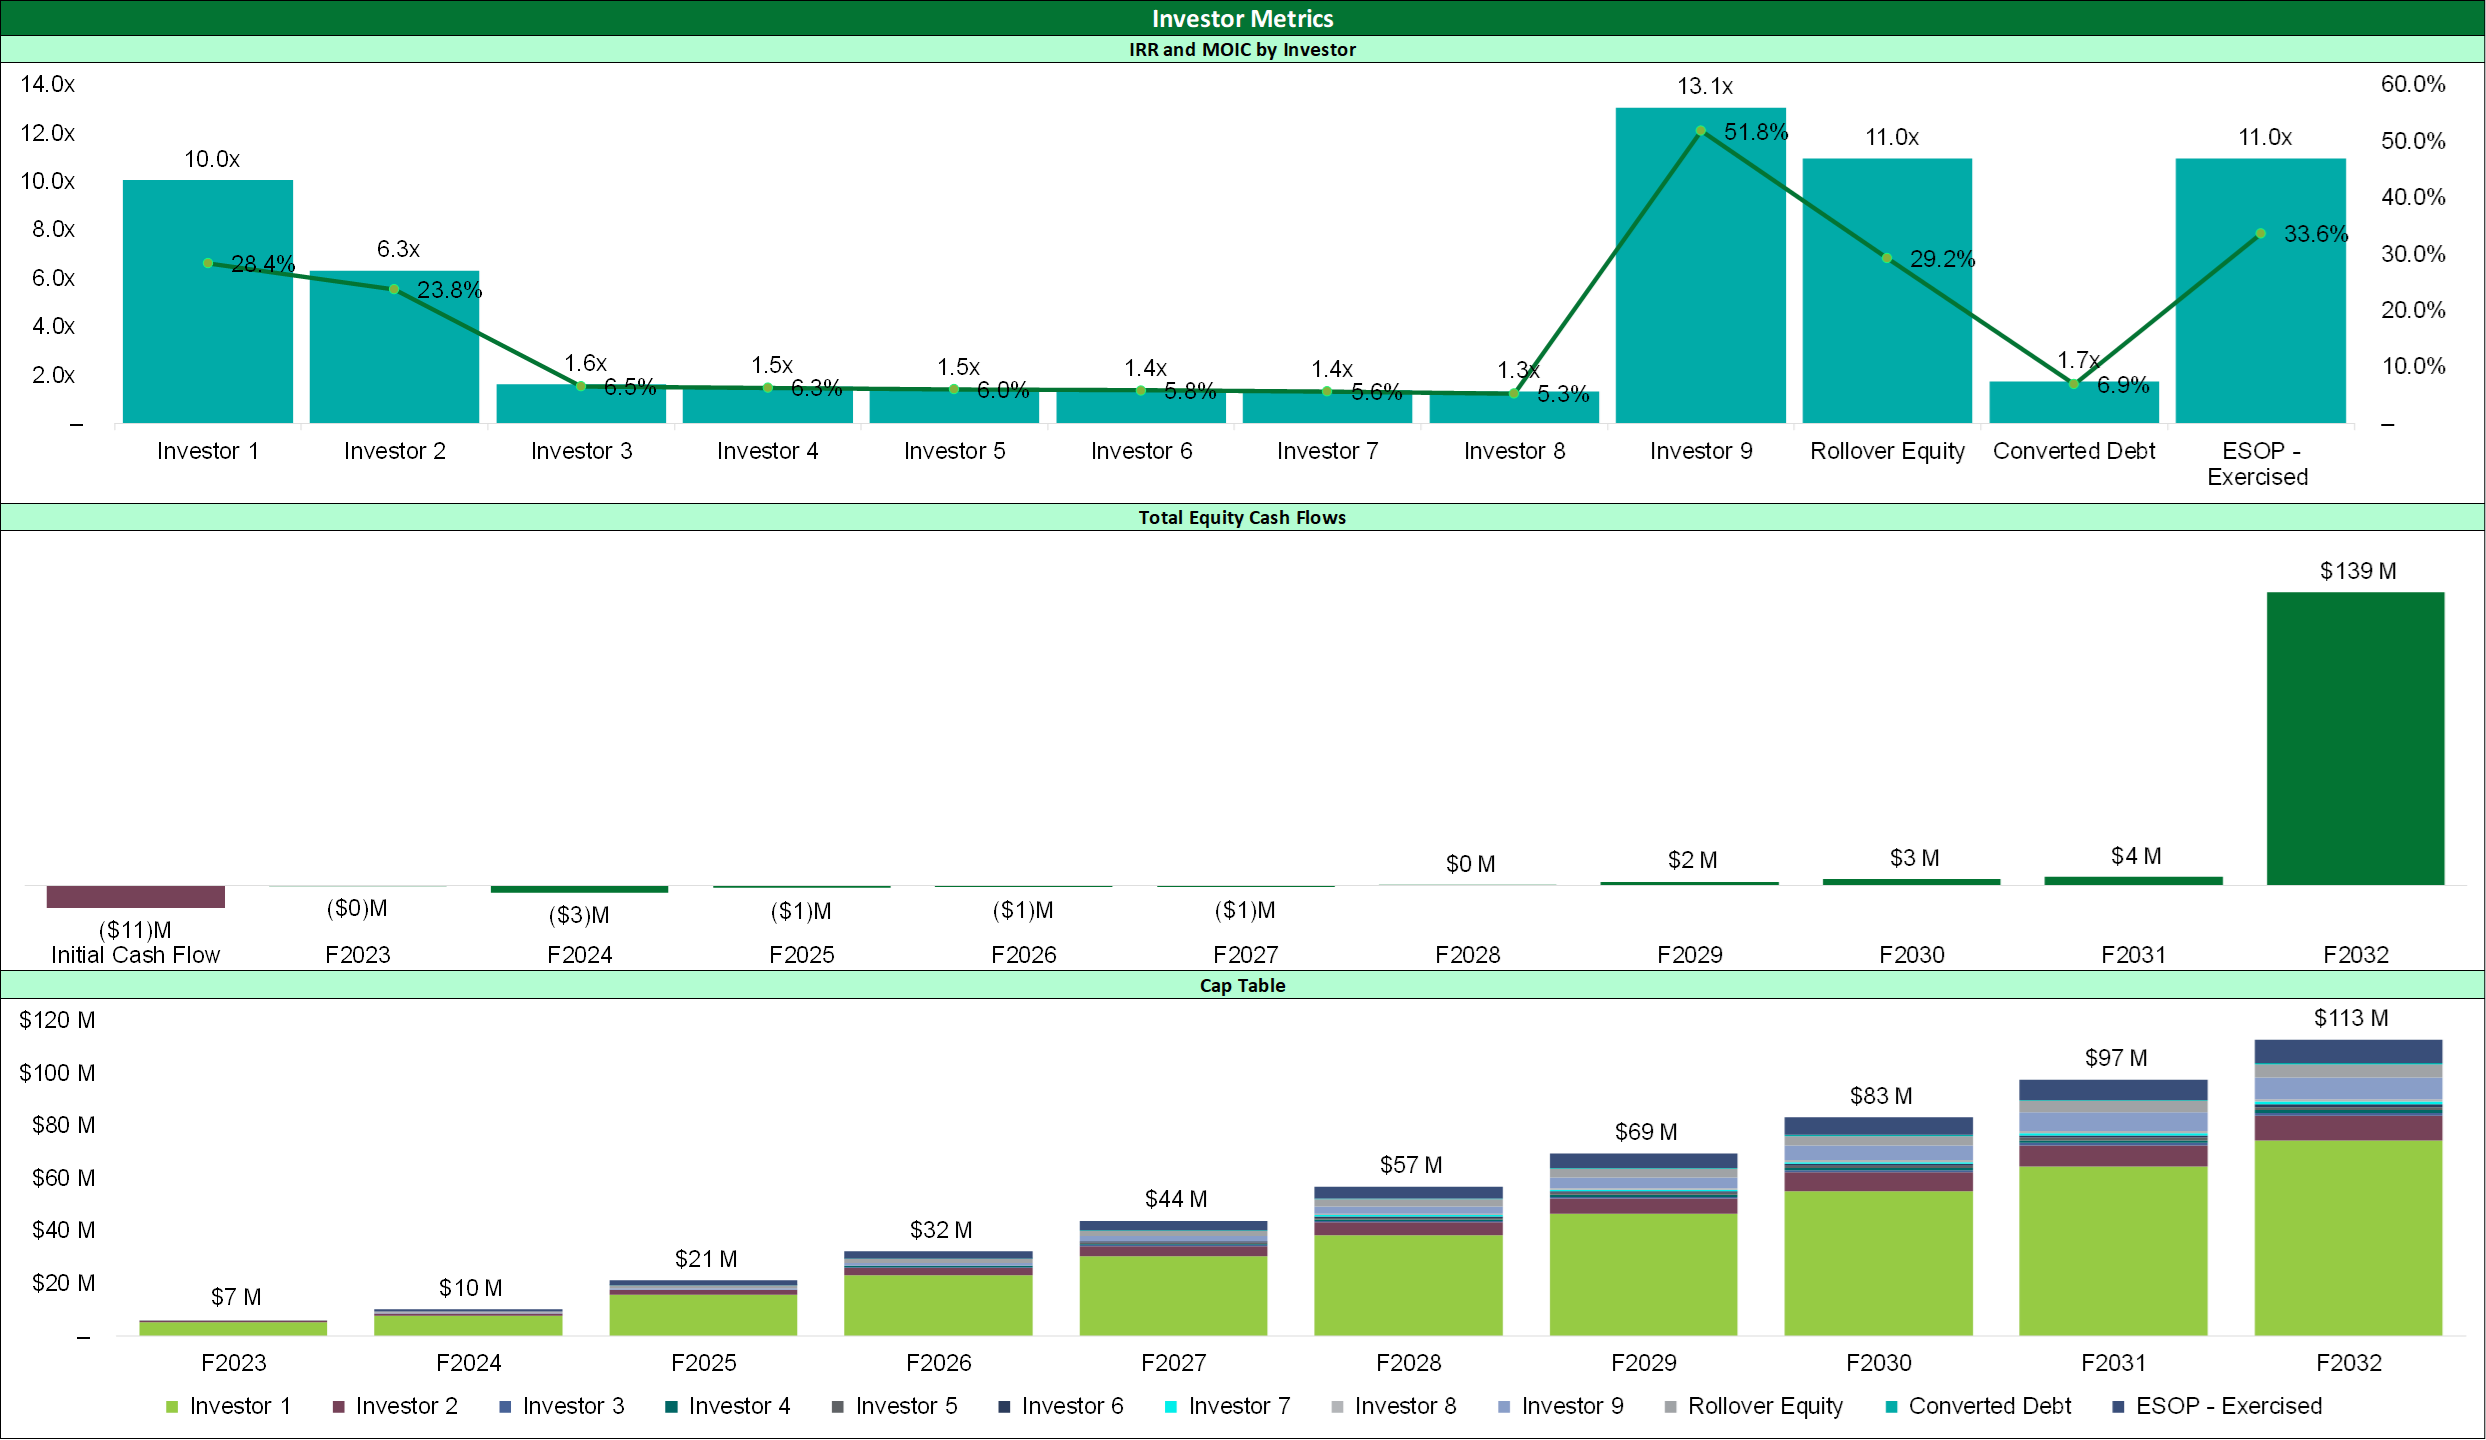
Exhibit C: Sample Charts of Investor Metrics. A well-designed chart can effectively summarize the return to each investor visually. These charts can provide insights to how much each investor will earn and the timing of the cash flow which will potentially facilitate the decision making or the communication of forecast results for investors and/or managements.
Conclusion
A dynamic revenue forecasting model is an essential tool for financial professionals aiming to streamline forecasting, optimize decision-making, and prepare for a range of market conditions. By incorporating automated adjustments, scenario analysis, and real-time financial insights, businesses can enhance their financial resilience and strategic agility. Whether for routine budgeting, mergers and acquisitions, bringing on new investors, or performance evaluations, these models can provide a reliable foundation for driving sustainable financial growth.


