
The condo market in Toronto and North America post-pandemic has been volatile. Overall, a significant increase in the cost of living across North America has been observed, with rental prices being a major contributor. According to the national rent report from Rentals.ca and Urbanation in May 2023, Toronto’s rent increased by over 40% in just two years. However, this trend has recently reversed, with purchase prices and rental rates down by 4.1% and 3.1% year-over-year as of July 2024, respectively.
What is the key to thriving in this turbulent market? By using financial modelling and breaking down the cash flows one can better understand and navigate market challenges and identify real estate investment opportunities.
Mastering Condo Investment: A Breakdown of Cash Flow and Returns
Investing in condos allows for a balanced approach to achieving both income and growth, with potential for long-term value appreciation in high-demand markets. To make informed decisions, it’s essential to understand the components of cash flow, and return is critical when investing in pre-construction condominiums. Below are the cash flows to consider in assisting with your investment thesis and decisions.
- Purchasing Cash Flow:
- Mortgage Proceed from Lender: Actual Cash inflow from a lender such as banks or capital investments from other investors
- Property Prices: This portion of the cost is the property price paid to the previous owner or the property developers. This price is typically financed through a mix of loan and buyer’s cash.
- Purchasing Cost: Closing costs, legal fees, taxation, and agent commissions during property purchases.
- Cash Flow during Holding Period:
- Effective Gross Income (EGI):
- Potential Base Rent: The total potential rental income earned from leasing out the condo.
- Free Rent and Concession: Incentives, such as rent-free periods or discounts, are offered to tenants.
- Absorption and Turnover Vacancy: The loss of money from the vacancy of tenant turnovers.
- Expenses Reimbursement: Costs covered by tenants, such as utilities or maintenance fees.
- Capital Replacement Cost: For investors with longer investment horizons, they should also take capital replacement costs into account. These include replacing or upgrading major building systems or components (such as Roofing, HVAC, Elevators, etc.) costs
- Financing Expenses: You should expect recurring financing expenses during the holding period.
- Interest Expenses: Payments made on the loan based on a specified interest rate and beginning principal balance. The interest rate may be fixed or variable based on the bank’s prime rates.
- Loan Principal Repayment: These are principal repayments made to the lender, typically recurring each month. These payments reduce the outstanding balance of the mortgage and the lender’s indebtedness.
- Leasing Cost:
- Leasing Commission (LC): The fee paid to a real estate agent for tenant search.
- Tenant Improvement (TI): The cost of renovating the condo to meet tenant needs.
- Exiting Cash Flow:
- Loan Repayment: Repayment of the remaining balance on your loan when selling the condominium.
- Selling Proceed:The amount you will receive from the buyer when selling the condominium.
- Selling Cost: Similar to purchasing costs, selling costs include expenses like agent commissions, legal fees, taxation, and other costs associated with closing the sale.
- Analysis of Key Performance Indicators: The value and the return from a condo investment are primarily driven by 1) NOI growth, 2) Cap Rate Reduction, 3) Debt Paydown and Cash Generation:
- NOI Growth: Net Operating Income (NOI) is a proxy for cash flow from rental income, excluding financing cash flows. It reflects the actual cash flow generation potential from the potential as they are independent of the financing decisions. Higher NOI signifies the income potential and enhances the value and return of the property investment. This can increase the valuation of property and the cash flow during the holding period. Higher NOI can derive from higher rents, lowered tenant turnover, or reduced operating expenses.
- Capitalization (Cap) Rate: The cap rate equals the ratio of next-twelves months’ NOI to the property gross price. It’s a standardized metric for property valuations where lower cap rates generally correspond to a higher property value.
- Cap Rate Reduction: A reduction in the Capitalization Rate (Cap Rate) typically signals a higher property value at exit leading to a higher investment return. Cap Rate is typically tied to market conditions, as it tends to be higher when the real estate market is optimistic. Cap rate trend can typically be observed from similar properties that are in the sale process.
- Debt Paydown and Cash Generation: As the property generates enough cash flow to reduce the loan balances, the equity percentage increases. This reduces the loan principal to be paid when selling the property. The faster the debt is repaid, the higher the return from this investment. In a declining interest rate environment, a higher portion of rental income can be used to pay down the principal balances instead of paying interest. This makes low-interest rate periods attractive to condo investors.
Excel-based Financial Model
With these concepts, Excel can be a powerful tool for calculating and delivering calculation results. In this simple model for investment for one condo unit, we have assumed the following variables based on our research and reasonable assumptions. As an institutional investor, the unit economics can serve as a guiding framework for a portfolio of condo unit investment, depending on their own specific investment mandate and fund size. The portfolio model will share the same set of inputs and similar assumptions as the portfolio investment return is an aggregation of returns from unit investments.
In this model, we have made several assumptions for the model inputs (Exhibit 1). Inputs based on online research are in shaded green. Inputs are often quoted as a dollar amount per rentable square feet (RSF). For investors, assumption quoted in per RSF are beneficial as they can easily conduct sensitivity analysis for the portfolio size. For example, if an investor is purchasing 10 condos, the only input change will be the RSF (the total RSF for all the units in the portfolio) and the model can easily calculate the return without any further changes. Please note that we are not responsible for the accuracy of the inputs and research. The URL sources for these green inputs are referenced at the end of the blog.
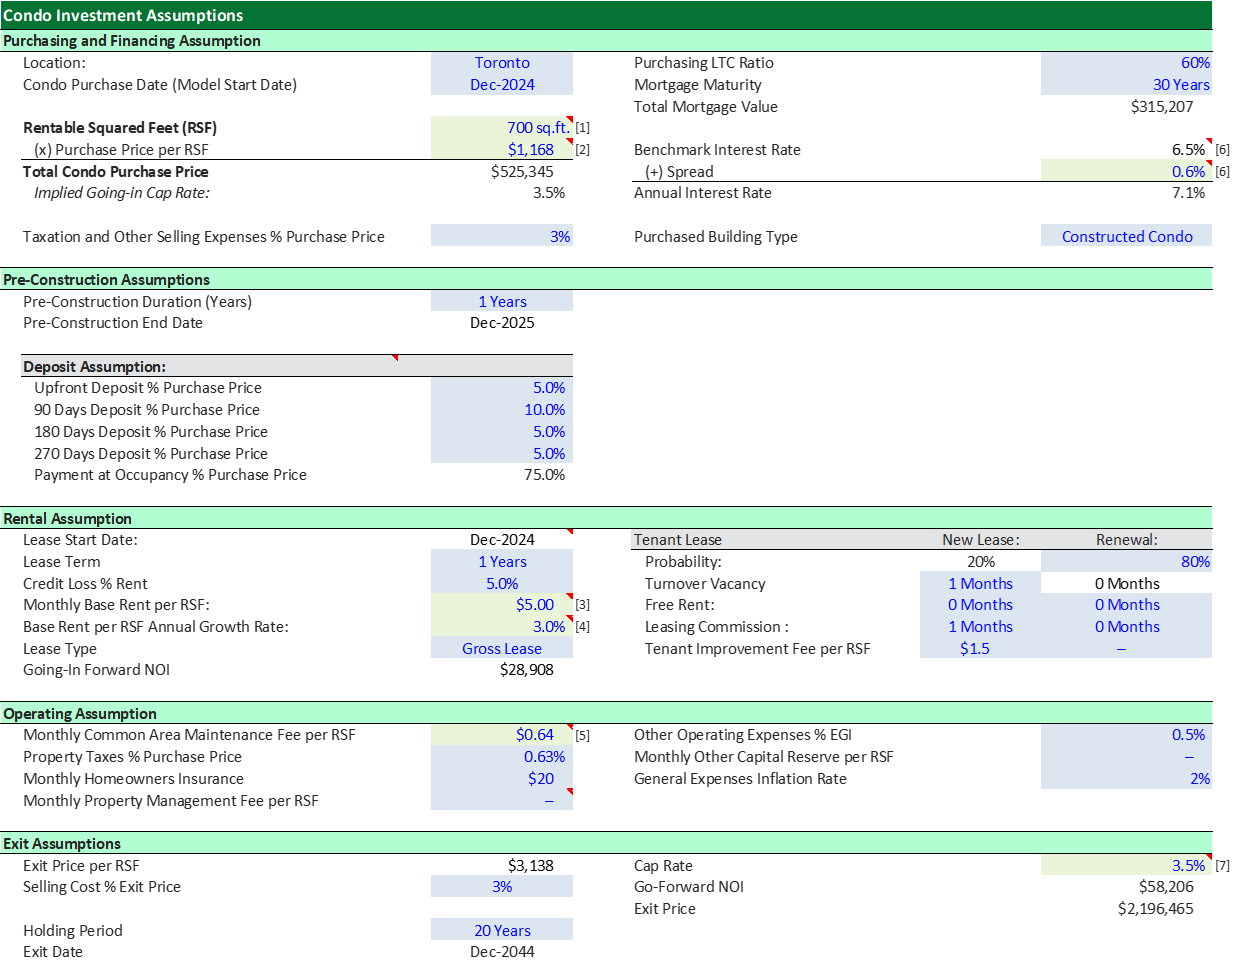
Exhibit 1. Assumed Inputs for the model. Please note that the inputs that are based on online research are tracked in green color
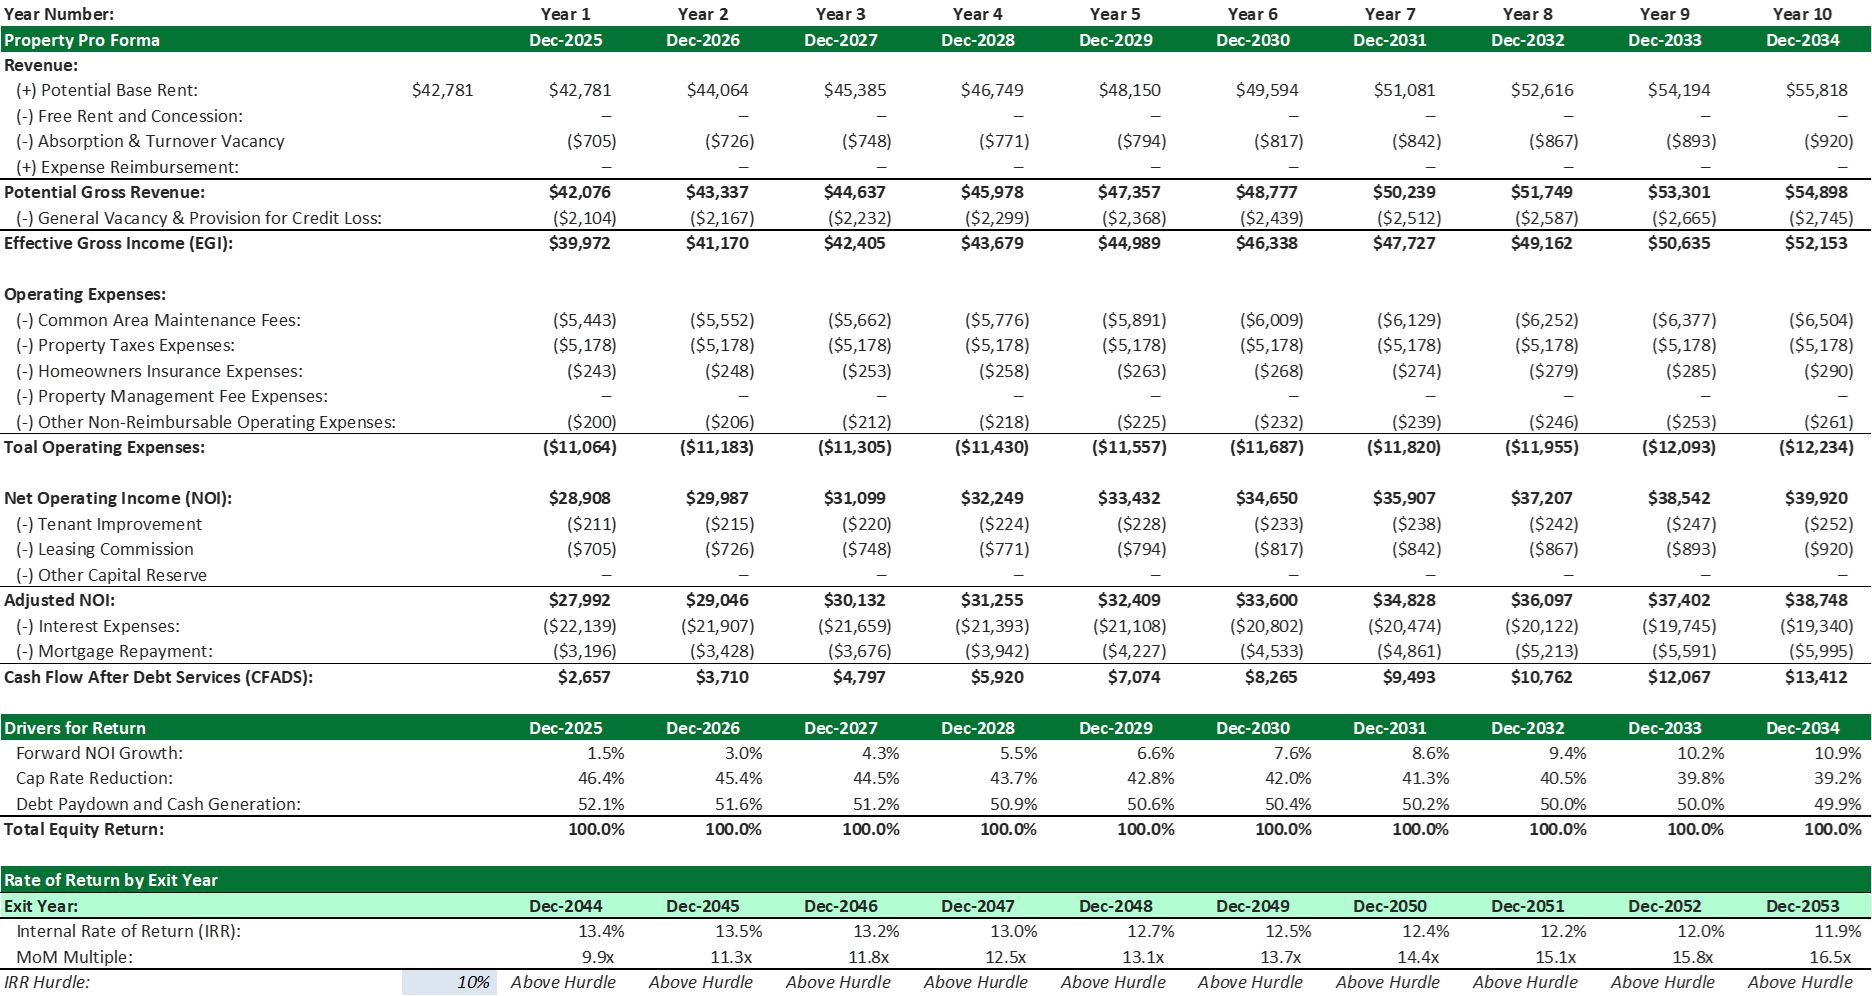
Exhibit 2. Financial Projections for a Condo Investment: This exhibit shows the cash flow projections and return breakdown for a condo investment using an Excel model. As the mortgage is paid down, interest expenses decrease and more cash is allocated to the principal repayment, which is the key driver for the return.

Exhibit 3. Key Drivers Analysis Chart: This chart visualizes the return breakdown for different exit dates. It highlights that debt paydown and cash generation are the main return drivers, with the impact of debt paydown and NOI improvements converging over time.
Summary of Analysis
Our Excel-based analysis reveals the following key observations:
- The model shows that debt paydown and cash generation are the primary drivers of return, and net operating income (NOI) improvement is the secondary driver. However, over time, the impact of debt paydown and NOI improvement tends to converge.
- During distressed times, when the renewal probability is lower, the turnover vacancy can dramatically decrease the return, as shown in the model.
- Different times come with different strategies:
- High-Interest Rate Era: In high-interest rate periods, a higher Loan-to-Cost ratio does not deliver a higher IRR since the interest expenses dominate the adjusted NOI.
- Low-Interest Rate Era: As the interest expenses decrease, the adjusted NOI can be allocated more to principal repayment, increasing your equity percentage and the IRR over time.
Real estate investment decisions are often marked by uncertainty. As shown in the above example, different economic conditions dictate different investment strategies. By understanding the breakdown of cash flows and the key drivers that influence investment returns, you can leverage an Excel-based model for stress testing to understand which levers will have the most significant impact on results.
List of Key Inputs and Sources for the model:
[1] Rentable Squared Fee (RSF): https://www.statcan.gc.ca/o1/en/plus/3237-condo-market-toronto-and-vancouver-home-investment-and-increasingly-rental-property)
[2] Purchase Price per RSF: https://financialpost.com/real-estate/great-toronto-condo-boom-finally-hit-wall#:~:text=The%20average%20opening%20price%20for,first%20quarter%20of%20last%20year.
[3] June 2024 Toronto Rent Report: https://liv.rent/blog/rent-reports/june-2024-toronto-rent-report/
[4] Rent Increase Guideline for Affordable Housing Program: https://www.toronto.ca/community-people/community-partners/social-housing-providers/affordable-housing-operators/rent-increase-guideline-for-affordable-housing-program/
[5] Monthly Common Area Maintenance Fee per RSF: https://condos.ca/blog/posts/the-costs-of-owning-a-condo?story_id=7402583&space_id=70665&uuid=f81c85a1-ccd3-48d7-8ee5-c5471941d7ce&component=post
[6] Benchmark Interest Rate & Spread: https://www.rbcroyalbank.com/mortgages/
[7] Cap Rate: https://mktgdocs.cbre.com/2299/3f774578-844c-4f7f-a4c4-e984f8a81abf-551506717/v032024/q22024-canadian-cap-rate-report-en.pdf
[8] November 2024 Rentals.ca Rent Report: https://rentals.ca/national-rent-report


