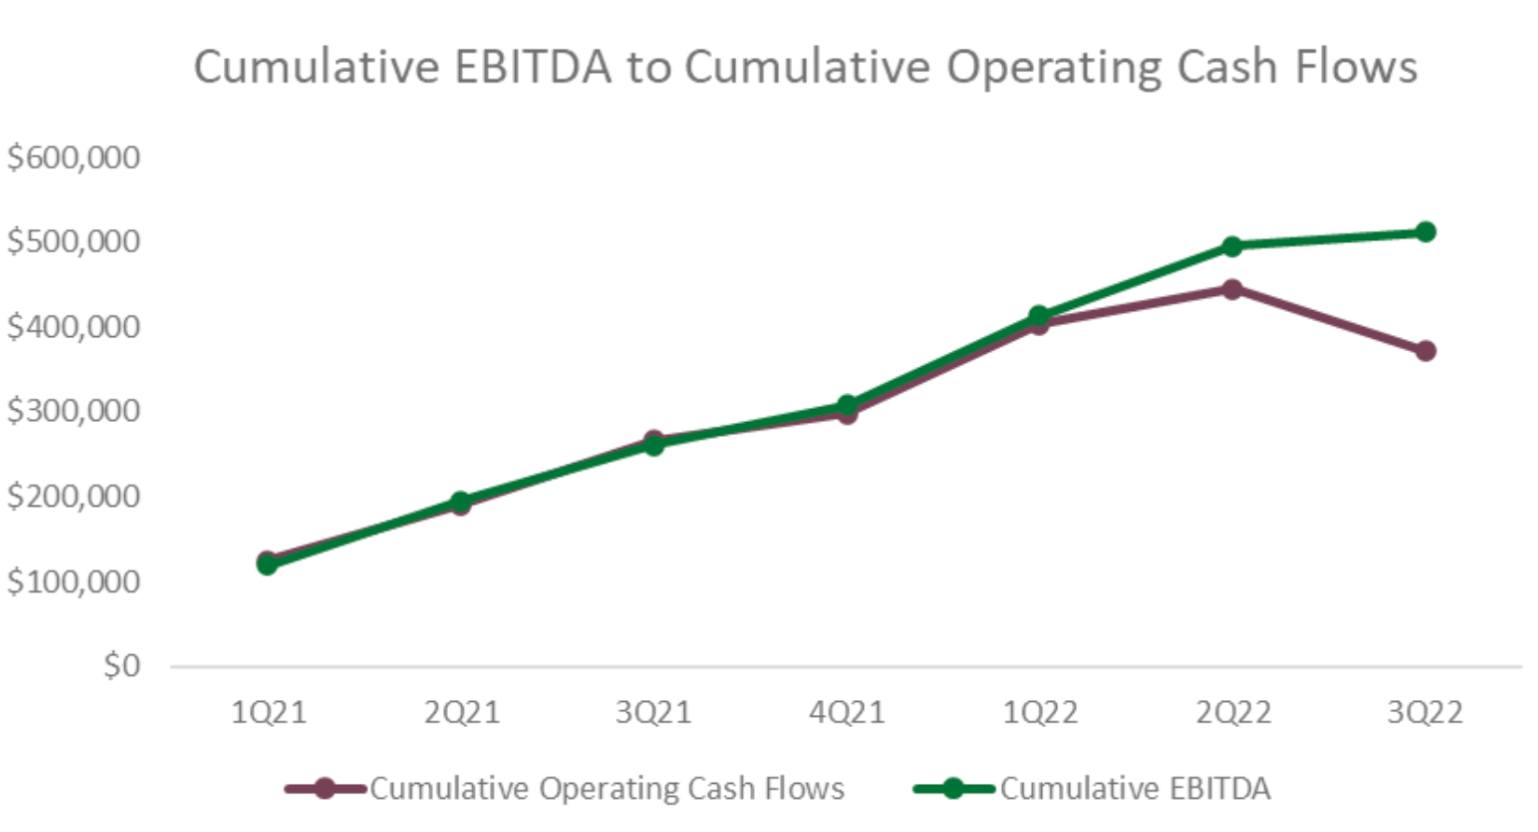
A key procedure in our work preparing Quality of Earnings (“QoE”) reports is to chart cumulative EBITDA against cumulative operating cash flows. The aim of this procedure is to provide quick insight into the accrual’s ratio of a business, which is a measurement of the degree to which aggregate accruals factor into a company’s earnings. There is empirical evidence that earnings with high aggregate accruals are more subject to mean reversion and should be considered lower quality. This is due to the fact that significant non-cash charges to either revenues or expenses, suggest that management estimates play a more significant role in the accounting results of the business.
Management has considerable agency on what is reported in the financial statements. Whether that is through aggressive sales recognition through accounts receivable or minimizing expenses through avoiding or understating write-downs of asset or inventory valuation among other possibilities.
During diligence it is important to remember that sellers have incentive to overstate earnings to try to reflect a better financial picture and achieve a higher sales price. Many transactions are based on a multiple of EBITDA so any incremental improvement to earnings has a direct link to the selling price. Through plotting cumulative EBITDA against cumulative OCF, such manipulation can be easy to spot as EBITDA is likely to begin outpacing cash flows. It is particularly important to investigate if there are deviations for the trailing twelve-month (“TTM”) period under analysis as this is where management is most likely to manipulate the financials.
Essentially the cumulative EBITDA to OCF chart is plotting the overall cash conversion ratio. The cash conversion ratio is Operating Cash Flows/EBITDA, analyzing the cash flow generating through the operating earnings of a business. A ratio close to 1 is indicative of quality earnings, where as a ratio below 1 is suggestive or poor-quality earnings with a high level of aggregate accruals.
The below chart shows an example of work performed by Sapling. It shows that earnings are of a high quality with lower aggregate accruals up until a few months before the end of the TTM period under analysis. Shortly before the end of the period EBITDA begins to outpace cash flows which suggests that earnings in the later months are of lower quality and perhaps are being manipulated by the seller.

The Cumulate EBITDA to OCF chart is not a sufficient procedure by itself. A key driver of its value is its ability to lead to better discussions with management. In the above example, cash flows fell below earnings because the business was investing in inventory to support future growth, in which case the lower cash ratio could be indicative of stronger future earnings.
Overall, plotting cumulative EBITDA vs Operating Cash Flow is a key procedure to determine earnings quality. Its value comes through the ability to quickly analyze the company’s cash conversion and lead to more informative discussions with management.


