
Paris. London. New York. Hong Kong. These are all cities that Torontonians are now in the habit of proudly comparing their own city to, in part to (sheepishly) justify the soaring real estate prices and torrid traffic here. Lower down on the list are less glamorous places like Atlanta (population 6.16M), San Francisco (8.47M) and Washington (9.44M), places that still overshadow the Greater Toronto Area’s population of 6.05M.
In today’s post, we see just how well Toronto stacks up against these 7 cities—at least in terms of a very limited measure, its subway. We’ll also throw in our perpetual rival, Montreal, just for good measure. In our analysis, we’ll (1) begin by looking at absolute metrics, like how many kilometers and subway stations are operated in the city, to help us in evaluating the scope of Toronto’s system for a city of its size and aspirations. Next (2), we’ll examine how well served the population is by the existing system, focusing on relative scope measures like the ratio of population to kilometers and stations. Then (3), we’ll do our best to evaluate the subjective experience of the systems’ riders, by applying ratio metrics we did earlier, like rides per car. Finally (4), we’ll end off by putting Toronto in its place along these three dimensions.
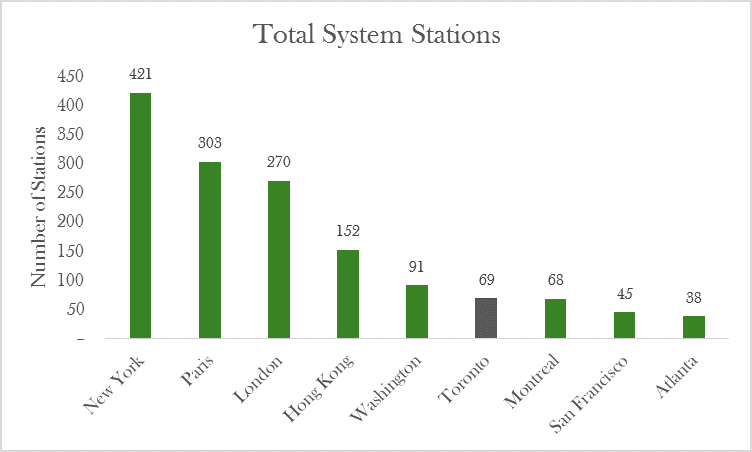
Beginning with the absolute scope measures (1), the first metric we’ll look at is Total System Stations. The obvious leader in this regard is New York, with 421 stations. It comes as no surprise that following the Big Apple are Paris, London and Hong Kong. Interestingly, though, Washington has 91 stations to Toronto’s 69, and Montreal is comparable with just one station less, at 68. Even so, Washington is the capital of the world’s sole remaining superpower, after all, so in edging out San Francisco and Atlanta Toronto falls just about where we’d expect.
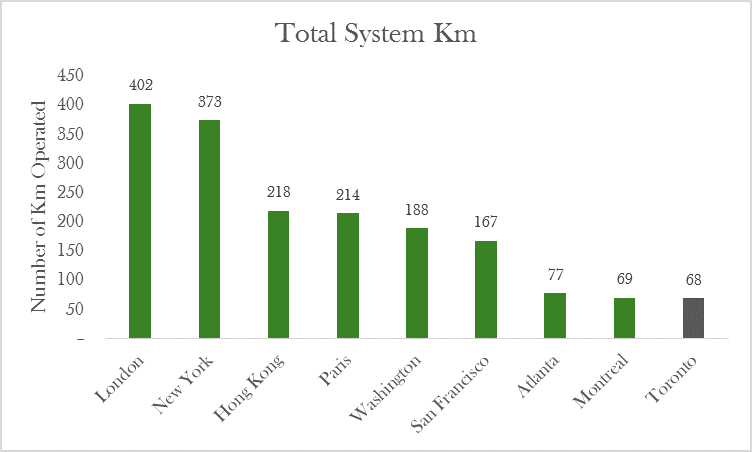
Things start to take a worrying turn for Toronto when we examine the total kilometers operated in the system, though. In my opinion, this is a far better measure of a system’s scope than the total number of stations (though convenience is reduced if there’s a lot of space between stations), as more kilometers mean more places you can visit without dragging along the car. Again, as expected, London, New York, Hong Kong and Paris, respectively, round out the top four. Toronto, though, comes in dead last, trailing even Atlanta (and yes, Montreal, albeit by a hair’s breadth). To make matters worse, while Toronto’s subway was basically finished in 1978 (except for the Sheppard “line to nowhere”), construction on Atlanta’s system only started in 1975, with service beginning in 1979. For a city that fancies itself a step above second-tier US cities like San Francisco and Atlanta, this is humbling for Toronto.
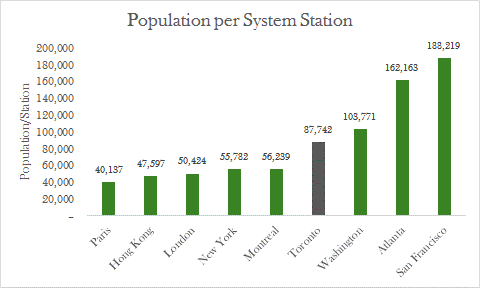
But, as we discussed earlier, most of these cities are actually bigger than Toronto, even if Toronto, admittedly, punches above its weight in terms of international influence as Canada’s leading city. In other words, for this analysis, at least, Toronto’s in the wrong weight class. So, how does the TTC’s subway compare when we adjust for metropolitan population (2)? Let’s start by analyzing the population per station. Once more we see Paris, Hong Kong, London and New York, in that order, leading the way. Despite these cities’ immense size, they are very well-served by the number of stations available to their residents. Anecdotally, every building in Paris—our leader here—is within 500 meters of a Métro station. Montreal has a good 35% less people per station than Toronto, testament perhaps to the fact that Toronto has grown a lot faster than its Francophone counterpart since the 1970s. Comfortingly for our collective ego, though, we effortlessly best the three second-tier American cities in this survey, with San Fran having an astonishing 2x more people per station than Toronto.
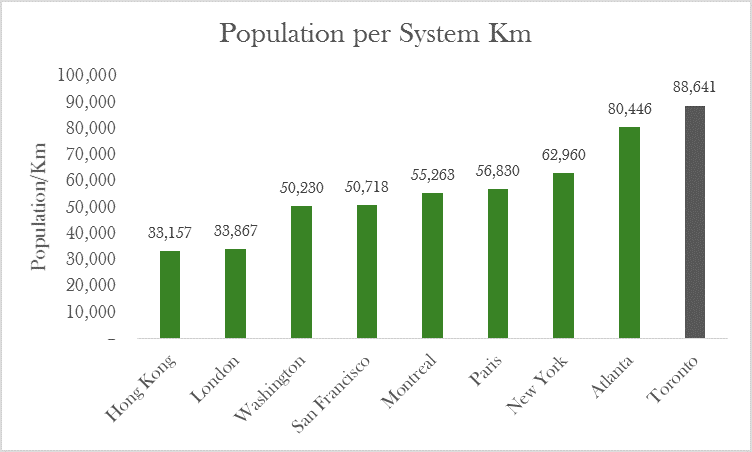
What about population per system kilometer? This is where things get really ugly for Hogtown. Out of the 9 cities, we rank dead last. In other words, our system is not only lacking in scope compared to aspirational cities like Hong Kong and London—as we saw a couple of paragraphs back—it’s lacking in scope for its own size, too. We have almost three times the number of people per km as Hong Kong and London, and close to double the number of people per km as Washington and San Francisco. To make this a little bit more concrete, if we had the number of km that Washington does, scaled to our population, our miserly 68 km would be 121 km—or 53 km more. Given that the 5.5 km Sheppard subway cost $973 million to construct (and we’ll ignore inflation since its opening 12 years ago), we need some $9 billion of investment to get us to a respectable spot internationally (ignoring the ongoing 8.6 km extension of the Spadina line into Vaughan).
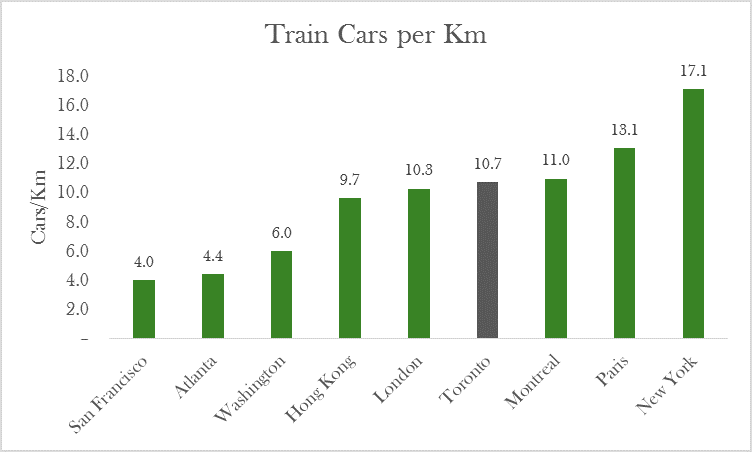
What about rider experience, though (3)? Toronto’s crowded, but not Paris crowded, right? Let’s start by looking at the number of train cars per system kilometer. This is a proxy measure of crowding not in the trains themselves, but on the tracks. It implies that all trains would be in use at a given moment, which isn’t entirely true, as a good fraction (30%?) would be out of service or in reserve at any point in time. At any rate, anybody who’s ridden the Yonge line southbound during morning rush hour is familiar with moments where the service comes to a standstill. How frequent are these in other cities? It turns out that they’re probably more frequent in Montreal, Paris and New York—but much less frequent in San Francisco, Atlanta and Washington, and a bit less frequent in Hong Kong and London. This is all assuming that the “headway” (spacing) between the trains is similar, which is not necessarily the most robust assumption, especially when some cities have automated driving. Even so, Toronto’s track intensity isn’t out of line for global cities—it’s just overloaded against the second-tier US cities, where transit adoption isn’t exactly soaring.
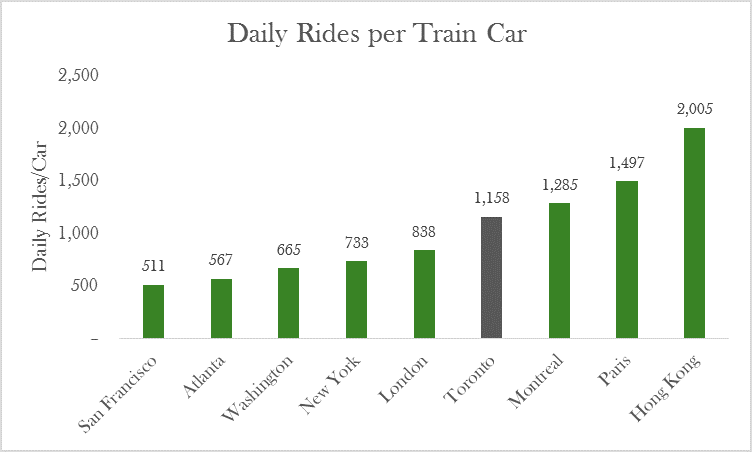
And the passenger experience? To gauge this, similarly to what we did earlier in this study, we look at daily rides per train car (bearing in mind that some days and hours will see packed cars and other days and hours empty cars). In this respect, again we fall behind the seemingly less crowded second-tier US cities of San Francisco, Atlanta and Washington. Surprisingly, though, New York and London are less jammed, while Paris and Hong Kong are (no surprise) closer to overflowing. And Montreal’s train cars—contrary to my own experience a few months ago—are just a little bit more packed-in than Toronto’s.
So where does this analysis place Canada’s Big Smoke? On an absolute basis, our system is far behind gleaming global cities like New York and London. It’s also trailing cities with less global cachet, such as San Francisco and Atlanta. On a relative basis as well, we’re doing poorly, falling behind even our old rival, La Métropole. To catch up and build out our system to adequately serve a city of our size, we’d need several billion dollars—money that exists, but that somehow hasn’t yet found its way into Toronto’s coffers. Finally, on a subjective “rider experience” level, we’re at least not the worst, but that is small solace when a city like San Francisco (with much better weather, and higher paying jobs) has trains about half as empty as ours.
An older friend of mine regularly reminds me that decades ago—in what must have been some wild dream of hers—officials from other transit systems around the world visited Toronto to glean insights that they could then apply in their own cities. Since that time, Toronto has been busy bickering (and expensively, signing and terminating contracts) while the rest of the world has been busy building. Hopefully, this post inspires you to write to your politicians and to scare them into action. If we’re to be the international city we believe ourselves to be, there’s a lot of work ahead.


