
In the fast-paced world we live in today, data sits at the core of everything. Organizations are turning to automation and business intelligence more than ever to stay competitive. Automation focuses on streamlining routine tasks and unlocking deeper insights – allowing teams to dedicate their time to more intricate and critical business matters. In recent decades, technology has evolved rapidly, bringing significant changes to various industries and how they operate. While many of these changes have had a positive impact, teams are now facing tighter deadlines and higher expectations as workloads continue to grow.
How Does Automation Improve Financial Reporting and Operations?
One of the key shared functions across almost every business is reporting. Finance professionals, operations managers, and business leaders all need visibility into what is happening behind the scenes, and more importantly, why. While systems, formats, and layouts may differ across industries, the core purpose remains the same: accurate reporting and insights that support decision making. In this environment, relying on manual processes and outdated systems only makes it harder to keep up with rising demands. This has led more organizations to adopt automation – not just to save time and improve efficiency, but also to stay ahead of their competitors.
Although automation can look different for each company, common applications include invoice entry, reconciliation, and, most importantly, report generation. These reports are not just numbers, they tell the story behind the scenes, the story that drives the decisions leaders make. Imagine how much time and energy can be saved when these processes are automated. When repetitive tasks are automated, teams gain access to a wealth of data. However, if that data is then handled manually to create reports, it simply creates another layer of repetitive work, defeating the purpose of automation in the first place.
What Is Business Intelligence (BI) and Why Does It Matter?
This is where Business Intelligence comes in. Business Intelligence (BI) is the process of transforming raw data into meaningful insights in the most useful and accessible way. It enables your data to be presented through well-designed dashboards and customized reports, allowing decision-makers to view the business from perspectives that matter most to them. BI is a powerful tool that paints a clear and reliable picture of what is happening at the core of your business. The reports can now be visually engaging, branded to your company, and tailored to your specific KPIs and management style.
With accurate and timely BI reports, potential bottlenecks and areas for improvement can be identified and addressed early, keeping your business on a path of continuous growth. In other words, your data becomes actionable; delivering insights before problems have the chance to grow. It’s no secret that humans are highly visual. MIT neuroscientists found that our brains can start processing images seen for as little as 13 milliseconds. (Trafton, 2014). As an example, take a look at the exhibit below: both signs are signalling the same warning, but when looking at sign B, our minds comprehend the message almost instantly, before we even get a chance to read the text on sign A. This speaks to the power and influence of visualization, especially for professionals on tight deadlines.

Exhibit 1. Visuals Superiority
How Can Businesses Successfully Implement Automation and BI?
At Sapling, our experience across various industries – from healthcare to real estate – enables us to bring a practical, well-rounded perspective to every engagement. We understand that no two organizations operate the same way, which is why our approach is always tailored to your company rather than one-size-fits-all. At the end of the day, it’s not just about implementing automation or building dashboards; it’s about creating solutions that genuinely support your team, simplify your processes, and help you make better, more informed decisions with confidence.
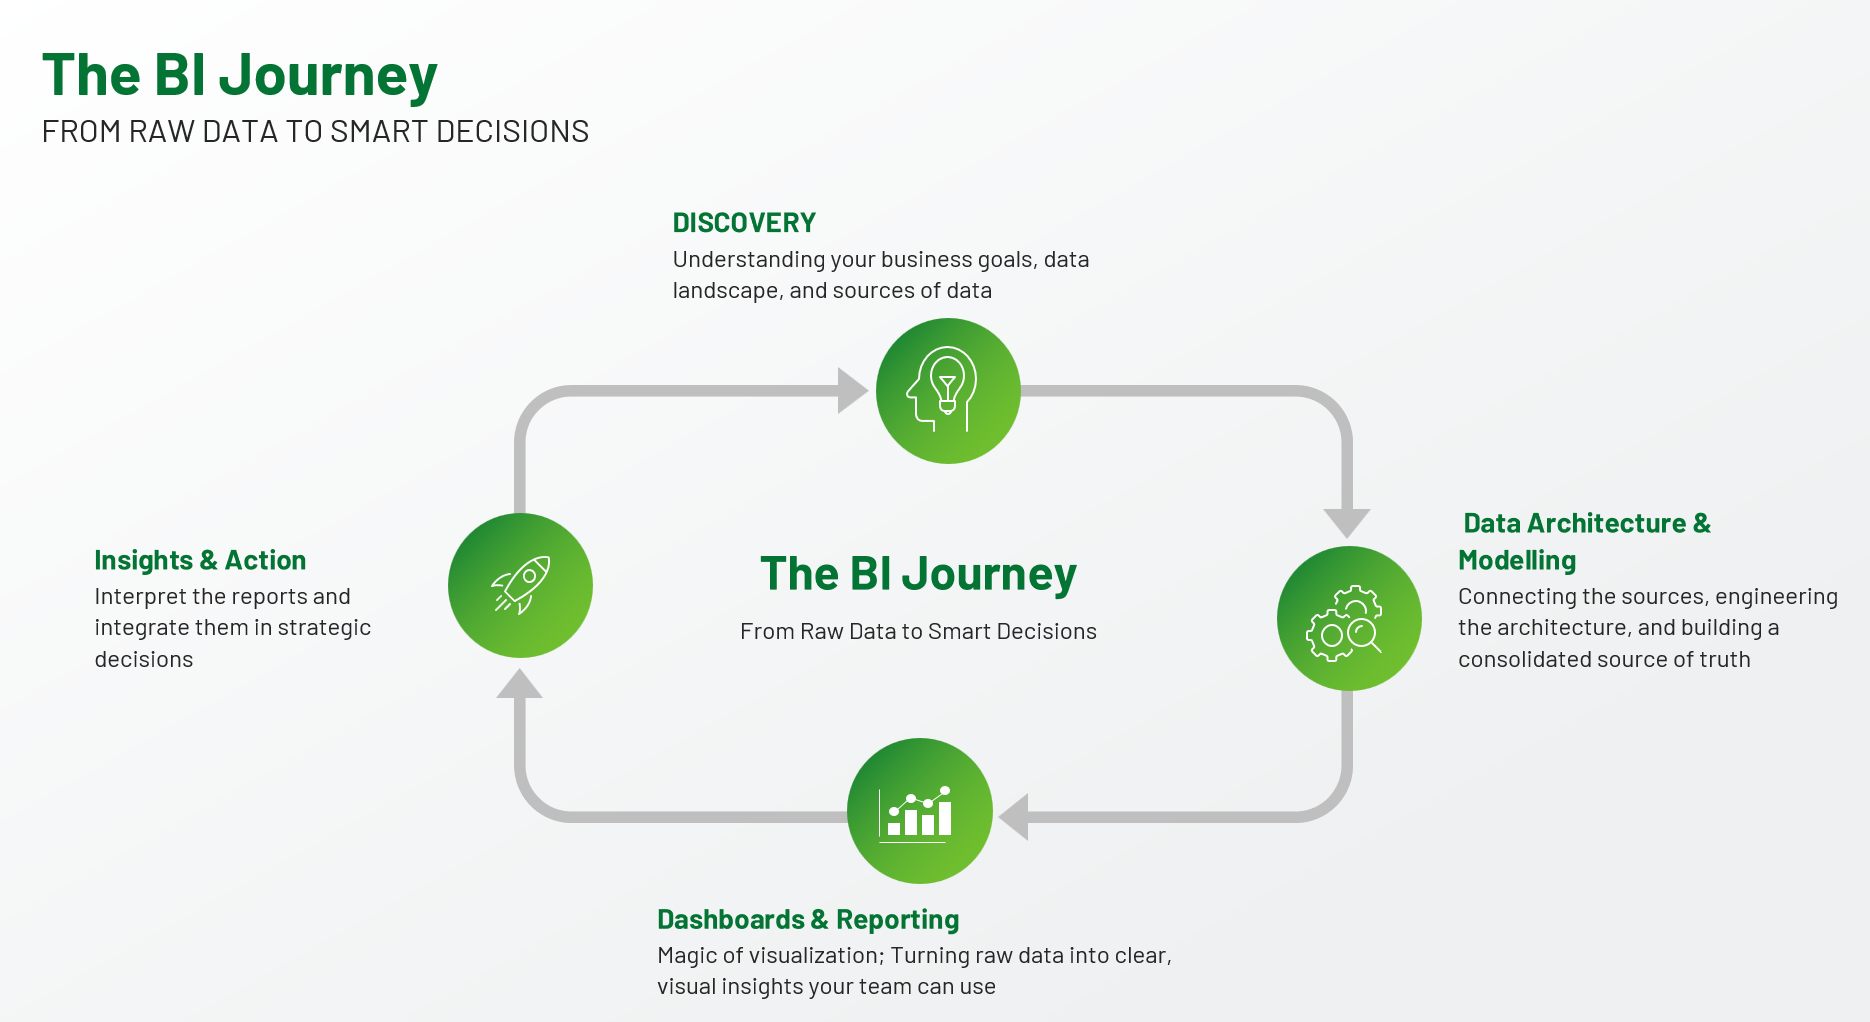
Exhibit 2. The BI Journey – From Raw Data to Smart Decisions


