Sapling’s approach to dashboarding begins with Defining the Key Performance Indicators (KPIs), by working with your company to gain access to your data systems and to determine where the data exists to support certain KPIs. We also use our finance and consulting experience to suggest KPIs that may be useful today and down the road as your company is growing.
The next step in the process is Automating the Data, which begins through data extraction from your company’s various systems, which may involve coding custom API calls, establishing database server connections, and processing emailed .csv reports. We then build a database that will serve as a “data warehouse”, hosting the automatically fed and updated data.
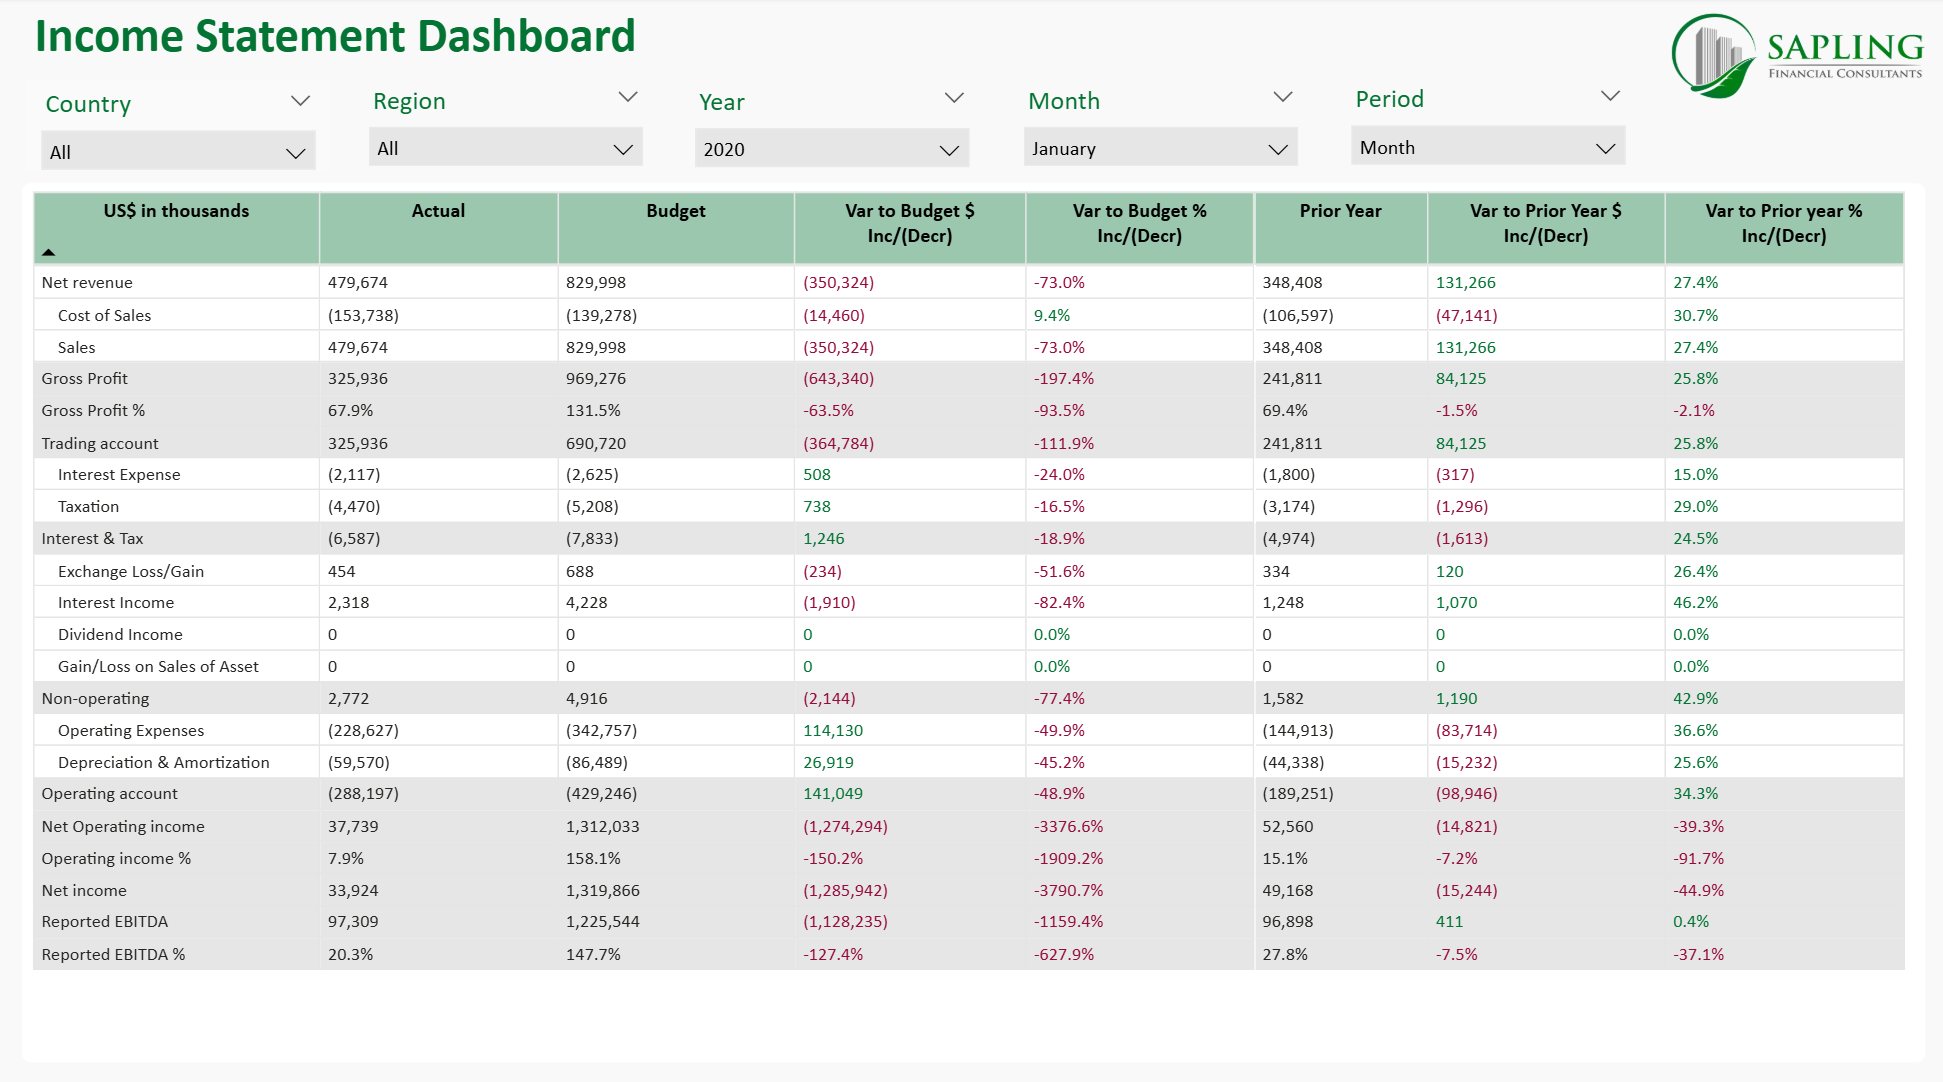
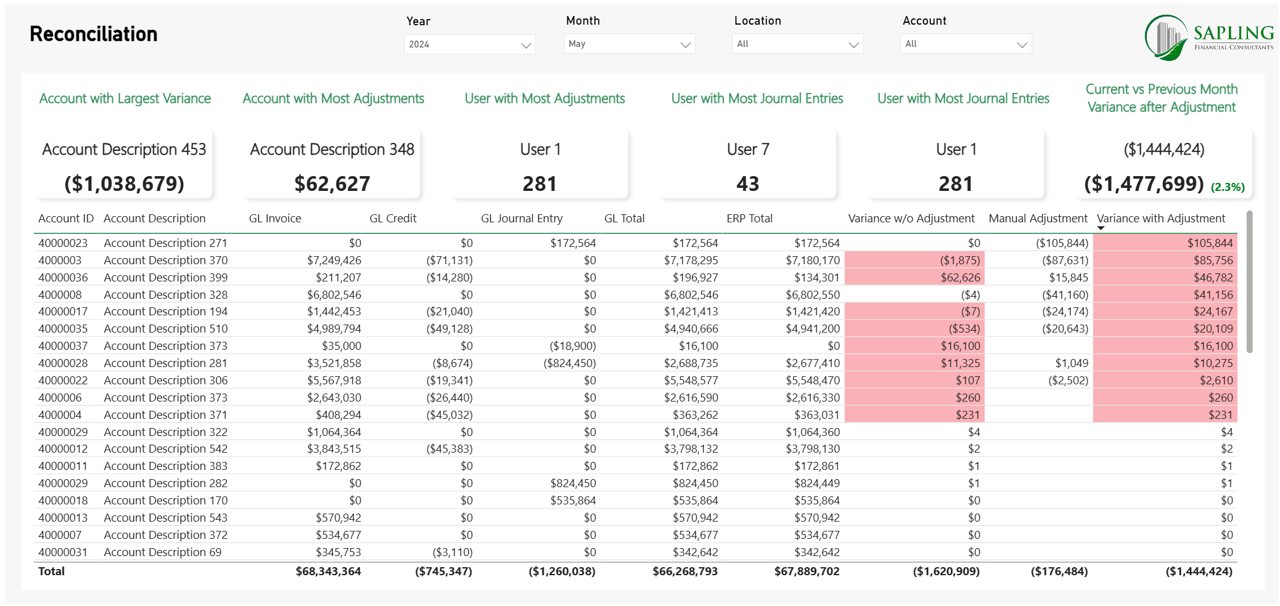
The last phase is Building the Dashboard. Our dashboards are designed to support drill down capability, offer real-time insights, and consolidate information from multiple data systems. We build different dashboards for different members on your team: the CFO, the COO, GP Investment Team, Regional Manager, etc. We primarily use Power BI, as well as Tableau, to create custom dashboards that provide a clear view of your business performance.
We also offer Standard BI Dashboards designed for mid-sized businesses. These dashboards help turn raw data into strategic insights, enabling smarter, faster decision-making across teams. Implementation requires collaboration to gather and integrate your data, ensuring the dashboards provide meaningful and actionable insights.
STANDARD BI DASHBOARDS WE OFFER
Related Blog


