CLIENT: Large Insurance Provider
An insurance company approached Sapling to develop Power BI dashboards to help keep track of the policies they sell and customer retention

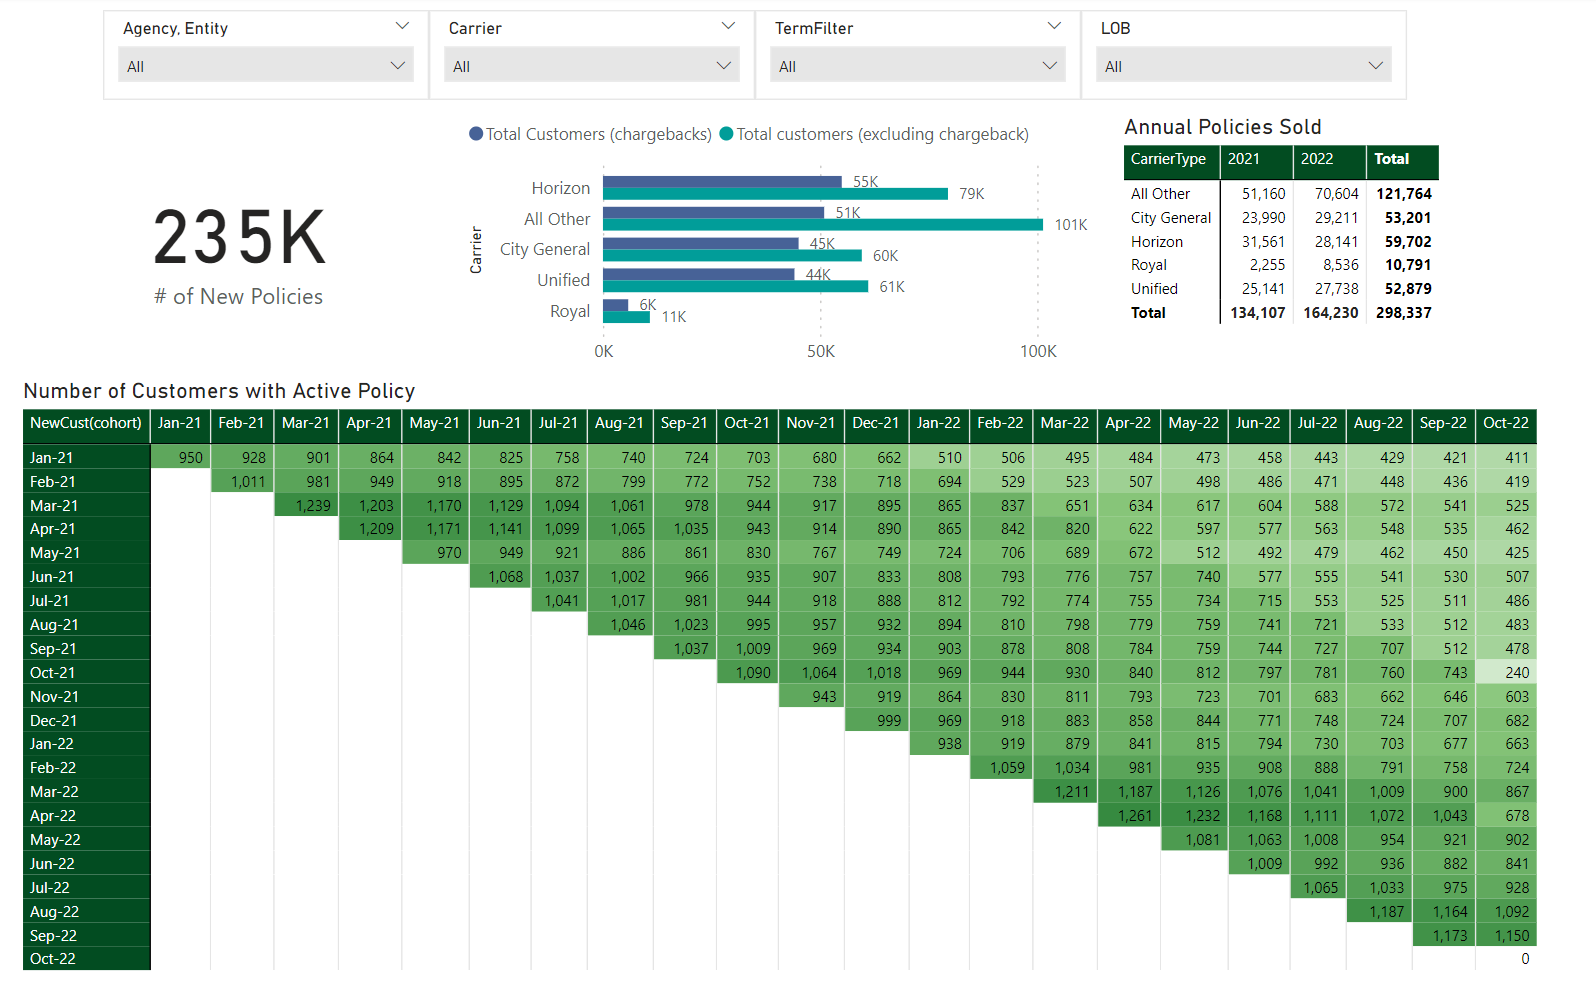
NUMBER OF CUSTOMER WITH ACTIVE POLICY
Latest Case Studies
An insurance company approached Sapling to develop Power BI dashboards to help keep track of the policies they sell and customer retention

We made dashboards to keep track of the policies being sold based on types and yearly improvements on certain key metrics

We calculated which customer has an active policy at any given point based on transactional data. We incorporated this into a cohort table to visualize how many of the customers maintained an active policy over the following months

As a result the client is not only able to monitor the growth of their business, but also to identify and rectify the underperforming aspects of the business where they can reach the greatest improvements

A B2B distributor selling to major retailers in the U.S. engaged Sapling to perform a sell-side Quality of Earnings review to support the planned sale of the business. The engagement focused on reconstructing and validating historical financial performance using transaction-level data, bank activity, inventory records,...

A heavy civil construction contractor running operations across several entities asked Sapling to build a management model that delivers private equity-level, best-in-class budgeting and scenario planning. The goal was a 3-statement model and dashboard that builds up from the project pipeline, so the team could...
We truly value the trust you’re placing in us by making this introduction. We’ll make sure to take great care of them and will reach out shortly to get the conversation started. We really appreciate the support.